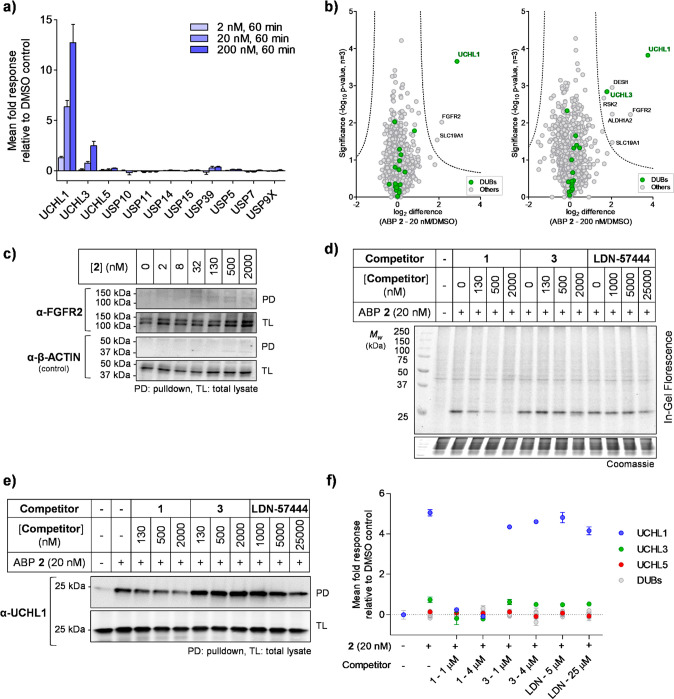
Figure 4.
Chemical proteomic analysis of ABP 2 labeling in HEK293 cells. (a) Selected DUB quantitative profiling by 2, demonstrating dose-dependent enrichment of UCHL1. Data represent mean ± SEM (n = 3). (b) Volcano plots showing log2 difference (fold change) and significance (−log10p-value) between protein enrichment at 20 or 200 nM 2 compared to DMSO control (two sample t test, n = 3, permutation-based FDR = 0.01, S0 = 1). (c) FGFR2 shows negligible enrichment by 2, as determined by pulldown and immunoblotting. (d, e, f) Compound 1 selectively competes with ABP 2, while 3 and LDN-57444 do not. Competition for ABP 2 labeling was confirmed by (d) in-gel fluorescence; (e) pulldown and UCHL1 immunoblotting; (f) pulldown and whole proteome quantitative proteomic analysis. Data represent mean ± SEM (n = 3).

