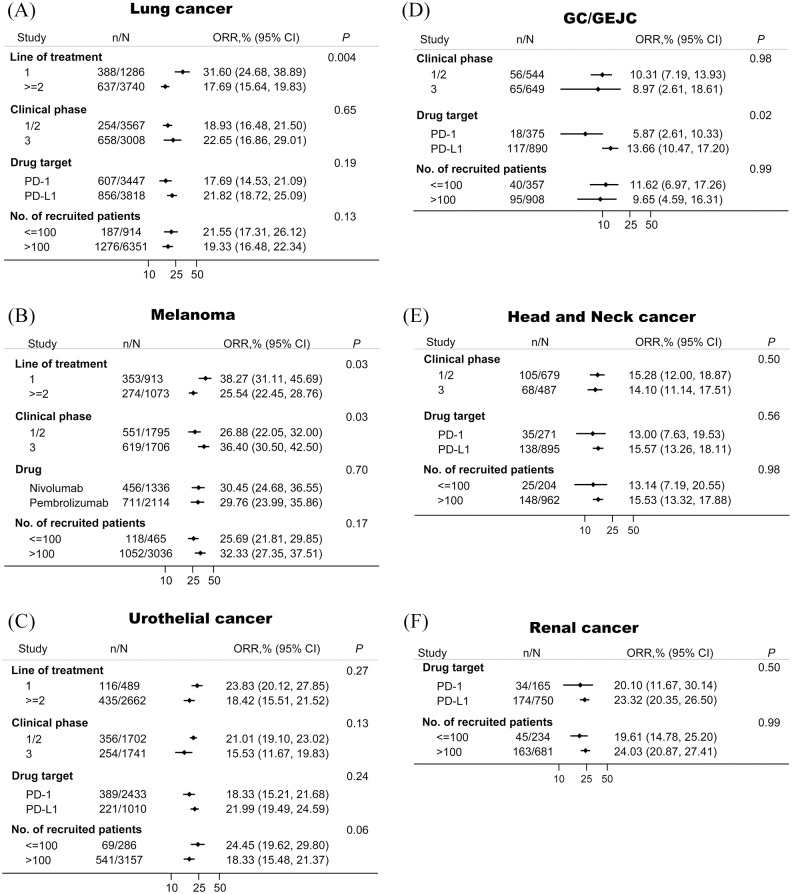
Figure 4.
The association between tumor responses and several major clinicopathological characteristics in lung cancer (A), melanoma (B), urothelial cancer (C), GC/GEJC (D), head and neck cancer (E), and renal cancer (F).
CI, confidence interval; GC/GEJC, gastric or gastro-esophageal junction cancer; ORR, objective response rate; PD-1, programmed cell death 1; PD-L1, programmed death-ligand 1.

