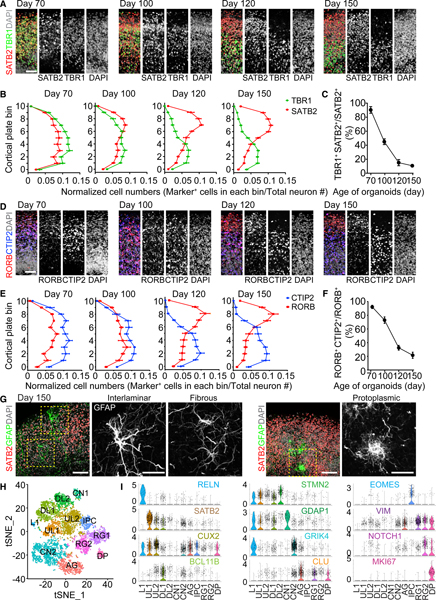
Figure 4. Establishment of Separated Upper and Deep Cortical Layers and Specification of Cortical Neuron Subtypes.

(A) Sample immunostaining confocal images of the CP of SNOs for SATB2 and TBR1. Shown are cropped 100 × 300 μm columns in the CP, and the pial surface is at the top. Scale bar, 50 μm.
(B) Quantifications of the distribution of SATB2+ and TBR1+ neurons in the CP. The CP is evenly divided into 11 bins; bins 0–10 follow the apical-to-basal direction. Shown are curves representing the normalized abundance within each bin, calculated as [no. of marker+ cells in a bin/no. of total neurons]. Values represent mean ± SEM (n = 10 SNOs from C1 and C3 iPSC lines).
(C) Quantification of the ratio of co-expression of TBR1 and SATB2 over SATB2+ cells in the CP. Same samples as in (B) are shown. Values represent mean ± SD.
(D) Sample immunostaining confocal images of the CP for RORB and CTIP2. Scale bar, 50 μm.
(E) Quantification of the distribution of RORB+ and CTIP2+ neurons in the CP. Shown is similar to (B). Values represent mean ± SEM (n = 10 SNOs from C1 and C3 iPSC lines).
(F) Quantification of the ratio of co-expression of RORB and CTIP2 over RORB+ cells in the CP. Same samples as in (E) are shown. Values represent mean ± SD.
(G) Sample confocal images of morphologically distinct GFAP+ astrocytes in day 150 SNOs. Note localization of an interlaminar astrocyte cell body near the pial surface and protoplasmic astrocytes in the SATB2+ upper layer. Scale bars, 100 μm.
(H) Graph-based clustering of cells from day 150 SNOs by single-nucleus RNA-seq (n = 6,888 nuclei). AG, astrocyte/glia; CN, cortical neuron; DL, deep layer; DPs, dividing progenitors; IPCs, intermediate progenitor cells; L1, layer I; RG, radial glia; UL, upper layer. Cell population identities were determined by gene enrichment analysis using cell type and layer-specific marker gene sets obtained from the Allen Brain Atlas (Hawrylycz et al., 2012) and published datasets of single-cell RNA-seq of the developing and adult human cerebral cortex (Fan et al., 2018; Lake et al., 2016; Nowakowski et al., 2017; Pollen et al., 2015).
(I) Expression of selected cluster-specific marker genes used for cell type classification. Shown are violin plots overlaid on scatterplots, where the proportion of cells expressing a given gene is the highest. The color coding for the gene names indicates the cluster in which the gene is most enriched.
See also Figures S2, S3, S4, and S5, Video S1, and Table S1.
