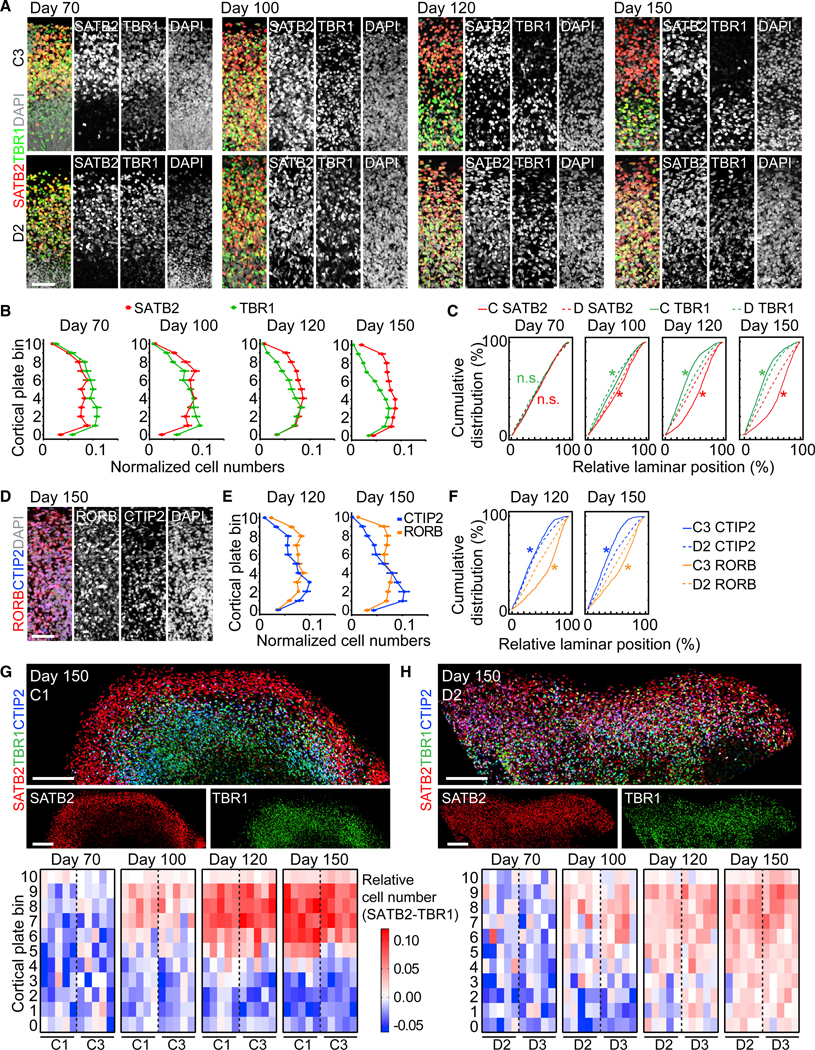
Figure 6. Aberrant Laminar Expression Patterns of Cortical Layers in mDISC1 SNOs.

(A) Sample confocal images of the CP of control (C3; top panel) and mDISC1 (D2; bottom panel) SNOs for SATB2 and TBR1. Scale bar, 50 μm.
(B and C) Quantifications of the distribution of SATB2+ and TBR1+ neurons in mDISC1 SNOs, to be compared with Figure 4B. Values represent mean ± SEM (n = 10 SNOs from D2 and D3 iPSC lines). Also shown in (C) are cumulative distribution curves of marker-positive neurons at each time point. Kolmogorov-Smirnov tests were performed between control (C) and mDISC1 (D) SNOs for SATB2 (red) and TBR1 (green; *p < 0.05; n.s.: p > 0.05). Same samples as in (B) and Figure 4B are shown.
(D–F) Disorganized laminar distribution of RORB and CTIP2 in mDISC1 SNOs. Shown in (D) are 100 × 300 μm columns from sample confocal images at day 150. Scale bar, 50 μm. Shown in (E) are quantifications of marker distribution at days 120 and 150, to be compared with Figure 4E. Values represent mean ± SEM (n = 5 SNOs). Shown in (F) are cumulative distribution curves of marker-positive neurons at each time point. Kolmogorov-Smirnov tests were performed between control (C) and mDISC1 (D) SNOs for RORB (orange) and CTIP2 (blue) (n.s.: p > 0.05; *p < 0.05). Same samples as in (E) and Figure 4E are shown.
(G and H) Comparison of cortical layers between the control and mDISC1 SNOs. Shown at the top panel are sample tiling confocal images of the CP in day 150 SNOs. Scale bars, 200 μm. Shown at the bottom panel are heatmap plots for the differential abundance between SATB2+ and TBR1+ in control (G) and in mDISC1
(H) SNOs, similar to Figure 5D. Same samples as in (B) and Figure 4 B are shown.
See also Figure S7.
