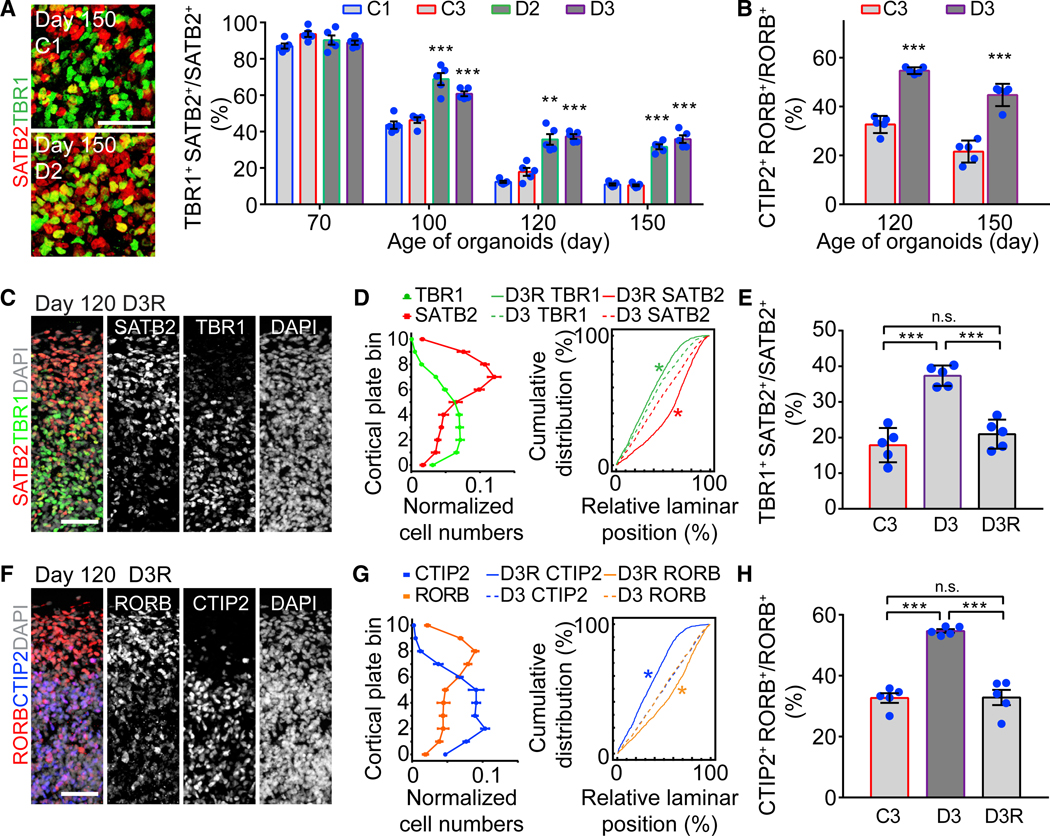
Figure 7. Cortical Neuron Fate Specification Deficits Caused by the DISC1 Mutation.

(A) Elevated co-expression between SATB2 and TBR1 in mDISC1 SNOs. Shown on the left are sample confocal images at the boundary between upper and deep layers with double-positive cells marked in yellow. Scale bar, 50 μm. Shown on the right is the quantification of the ratio of SATB2 and TBR1 co-expressing cells over SATB2+ neurons. Same sample as in Figure 6B is shown. Values represent mean ± SEM (***p < 0.0005; Student’s t test).
(B) Elevated co-expression ratio between RORB and CTIP2 in mDISC1 SNOs. Same sample as in Figure 6E is shown. Values represent mean ± SEM (***p < 0.0005; Student’s t test).
(C and D) Restored layer-specific expression patterns of SATB2 and TBR1 in day 120 SNOs derived from the isogenic D3R iPSC line, in which the DISC1 mutation was corrected. Shown in (C) are 100 × 300 μm columns from sample confocal image. Scale bar, 50 μm. Shown in (D) (left) is the quantification for marker distribution in the CP. Shown is similar to Figure 4B. Values represent mean ± SEM (n = 5 SNOs). Shown in (D) (right) are cumulative distribution curves. Kolmogorov-Smirnov test was performed between D3R and D3 SNOs for SATB2 (red) and TBR1 (green; *p < 0.05).
(E) Restored ratio of co-expression between SATB2 and TBR1 to a normal level in SNOs derived from the isogenic D3R iPSC line. Same samples as in (D) are shown. Values represent mean ± SD (***p < 0.0005; Student’s t test).
(F and G) Restored layer-specific expression patterns of RORB and CTIP2 in day 120 SNOs derived from the isogenic D3R iPSC line. Shown in (F) are 100 × 300 μm columns from sample confocal images. Scale bar, 50 μm. Shown in (G) (left) is the quantification for marker distribution in the CP. Values represent mean ± SEM (n = 5 SNOs). Shown in (G) (right) are cumulative distribution curves. Kolmogorov-Smirnov test was performed between D3R and D3 SNOs for RORB (orange) and CTIP2 (blue; *p < 0.05).
(H) Restored ratio of co-expression between RORB and CTIP2 to the normal level in D3R SNOs. Same samples as in (G) are shown. Values represent mean ± SD (***p < 0.0005; Student’s t test).
