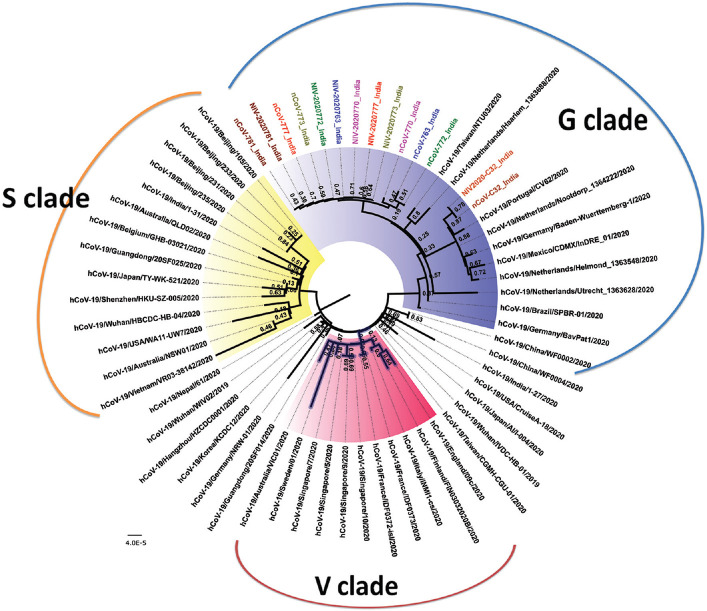
Fig. 4.
Neighbour-joining tree of SARS-CoV-2. The phylogenetic tree is generated using the best substitution model. A bootstrap of 1000 replicates was used to assess the statistical robustness of the tree. Same colours are used for sequences derived from a clinical sample and the respective isolate. Clinical samples are labelled with initials as nCoV while the isolates are labelled with initials as NIV. The clades are represented by different colours in the core region (S - yellow, V - pink, G - blue and unclassified - not coloured).

