
Figure.
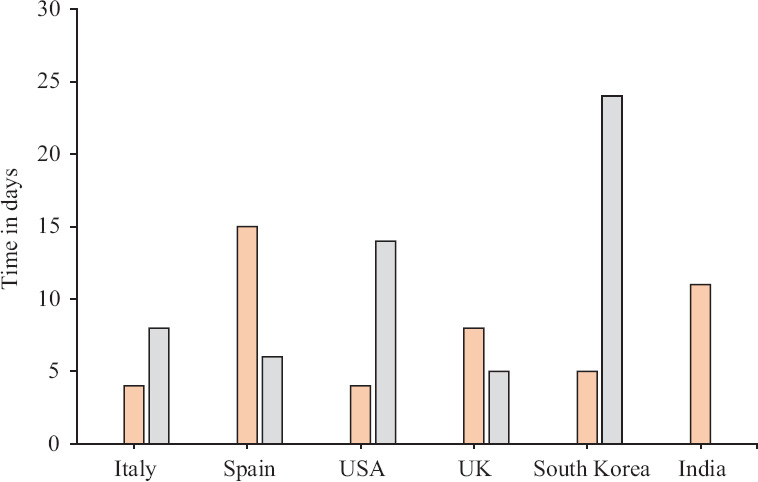
Time to 100 deaths due to COVID-19. The orange bars indicate the time from the first recorded death to 10 deaths. The grey bars show the time taken for the cumulative number of deaths to at least 100 in each of these countries. Source: Ref. 6.