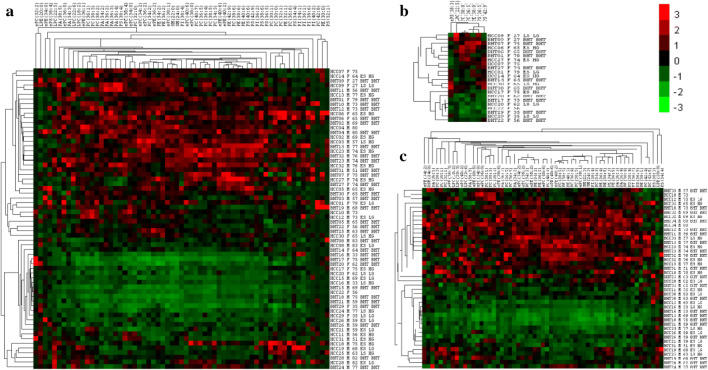
Fig. 3.
Heatmap and hierarchical cluster analysis (HCA) for individual PL species that was significantly different between BHT and HCC. The data were normalized by the Z score. The scale bars in color reflect changes in PL concentrations: squares in red represent higher PL concentration, and squares in green represent lower PL concentration. a heatmap and HCA for 62 individual PL species in all population; b heatmap and HCA for seven individual PL species in female population; c heatmap and HCA for 59 individual PL species in male population

