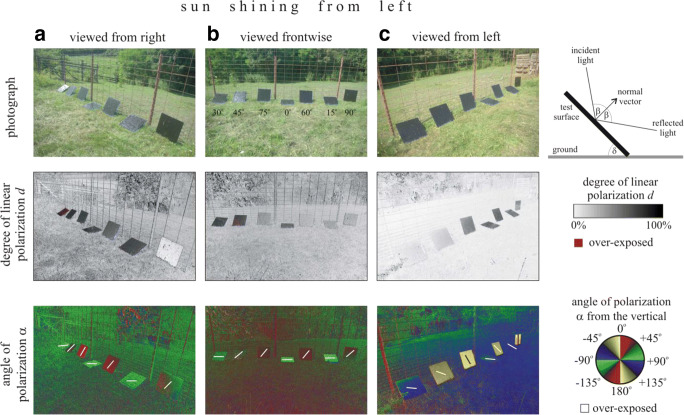
Fig. 1.
Photographs and patterns of the degree of linear polarisation d and of the angle of polarisation α (measured clockwise from the vertical) of the tilted shiny black sticky test surfaces used in field experiment 1 and measured with imaging polarimetry in the blue (450 nm) spectral range from three different viewing directions (from right, front, from left) relative to the straight line of the series of surfaces. The sun shone from the left side. The tilt angle of the optical axis of the polarimeter was − 30° from the horizontal. In the photo of column B, the tilt angles of the test surfaces are given. The (white, black) bars in the α-patterns represent the local directions of polarisation. Inset in the top right corner, geometry of light reflection from a tilted test surface. δ, tilt angle; β, angle of reflection

