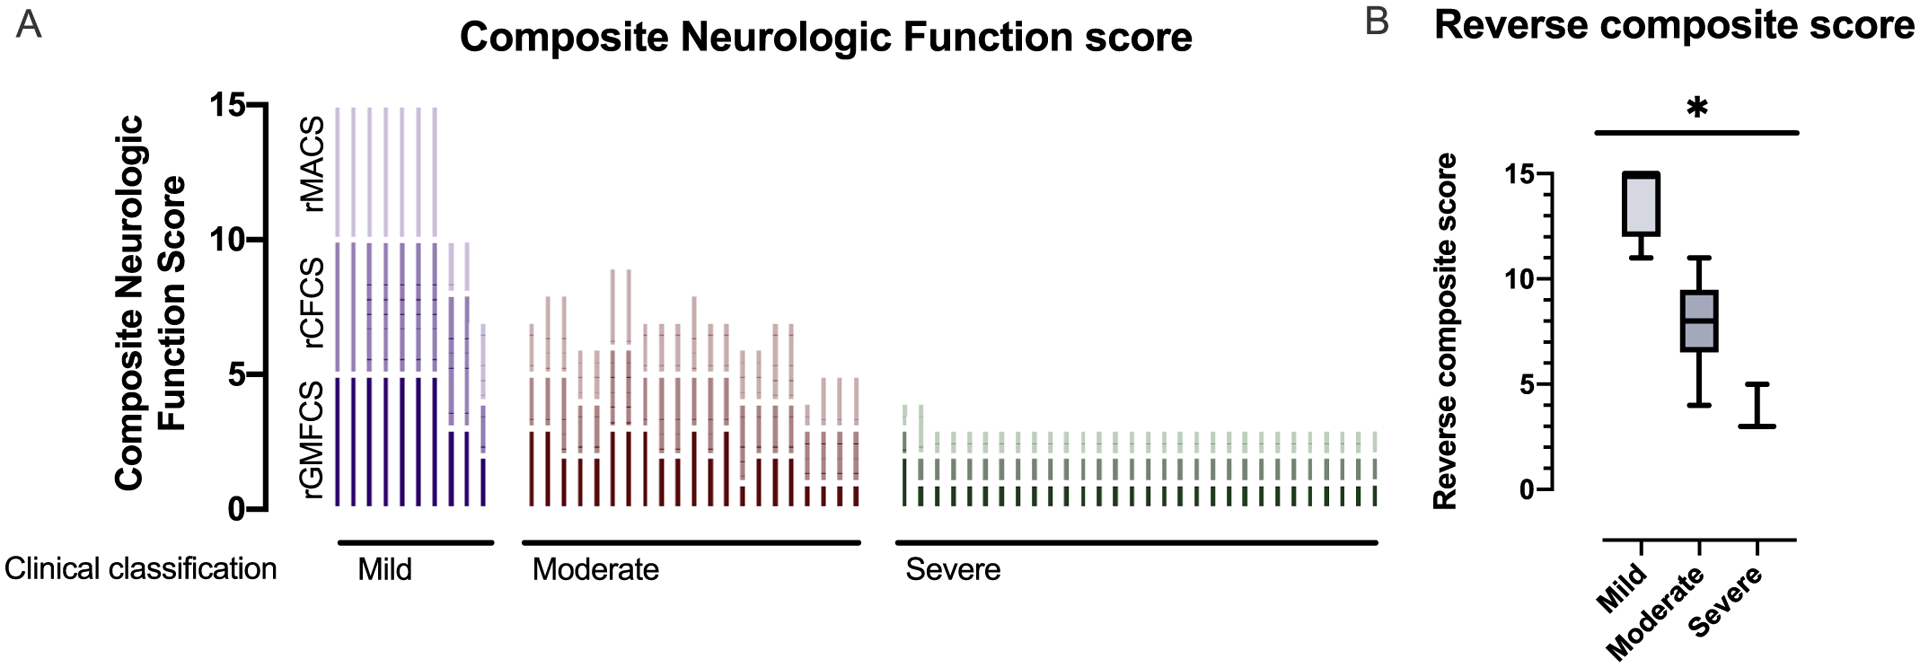
Fig. 2.

Neurologic severity in AGS. (A) Three classification scales (GMFCS, MACS, and CFCS) were applied to the most recent available clinical encounter retrospectively in 61 children with molecularly confirmed AGS and are presented as reverse composite (rComposite) scores. Individuals are clustered by severity classifications. Higher rComposite scores indicate less impairment. (B) Clinical severity was assigned to each clinical encounter as mild-moderate-severe. The rComposite scores were compared across the severity classifications: mild (n = 10, mean 14.00 ± 1.63 standard deviation [SD], range 11–15), moderate (n = 21, mean 7.91 ± 1.95 SD, range 4–11), and severe (n = 30, mean 3.10 ± 0.40 SD, range 3–5) categories (Kruskal-Wallis test p value < .0001 for all comparisons).
