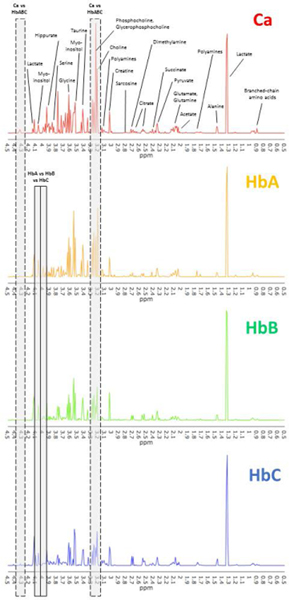
Figure 2. Representative spectra for the comparison groups.
Representative spectra for cancer (Ca, top) and histologically benign samples at different distances from cancer (increasing distance; HbA, HbB, HbC). All samples are from the same prostate, which was also used for the analysis on organ level. Metabolites were assigned based on literature values (Supplementary Table S1), and visually distinct peaks are labeled here. Exemplary regions that appeared significant in multivariate analysis are boxed (Ca vs HbABC, cancer versus benign; HbA vs HbB vs HbC, differences between histologically benign tissue at different distances).

