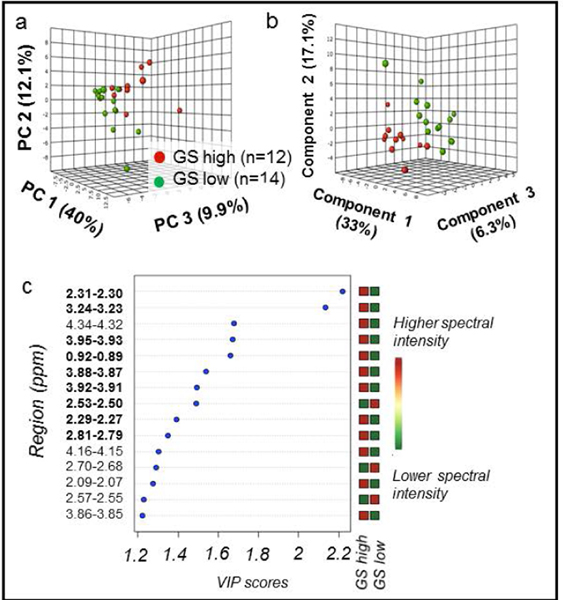
Figure 4. PCA and PLS-DA distinguish GS among cancer samples.
Cancer samples, with CaGS high defined as ≥4+3 (n = 12) vs. CaGS low as ≤3+4 (n = 14). (a) PCA score plot with PC1 (40% of variance), PC2 (12.1%), and PC3 (9.9%). (b) 10-fold cross-validated PLS-DA score plot (R2Y = 0.84 and Q2Ycum = 0.48) with Component 1 (33% of variance), Component 2 (17.1%), and Component 3 (6.3%). (c) PLS-DA VIP scores of Component 1 that are >1 and corresponding fold changes for regions are presented. A red square indicates that sample group has a higher spectral intensity for a given region. Bold spectral regions indicate which regions both had VIP > 1 and were significant in univariate analysis.

