Figure 2.
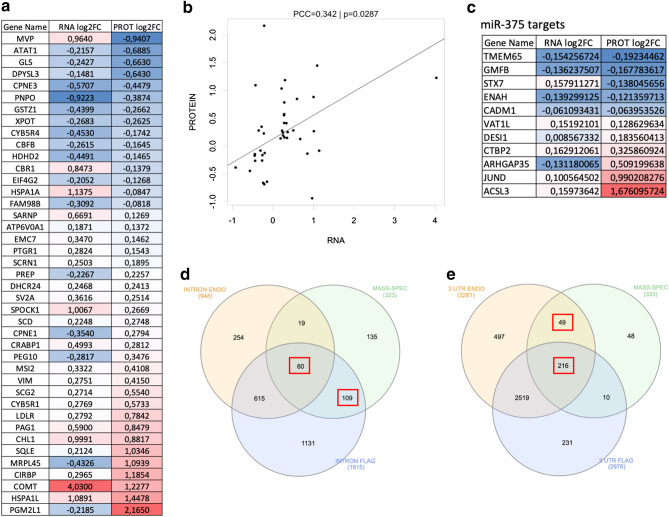
Proteomics, transcriptomics and FUS interactomics analyses in motoneurons. (a) Table showing genes encoding for differentially expressed proteins, ordered by fold change, and differentially expressed mRNAs, in FUSP525L motoneurons compared to FUSWT ones. Color code: blue, downregulated; red, upregulated. (b) Correlation between transcript and protein levels of genes enlisted in (a). PCC: Pearson correlation coefficient; p: p value. (c) Table showing miR-375 target genes that encode for differentially expressed proteins in FUSP525L motoneurons. Color code: blue, downregulated; red, upregulated. (d) Venn diagram showing the overlap between proteins that are altered, in any direction, in FUSP525L motoneurons (“MASS-SPEC”) and transcripts that are bound in intronic regions by endogenous FUSWT (“INTRON ENDO”) or exogenous FLAG-FUSWT (“INTRON FLAG”). (e) Venn diagram showing the overlap between proteins that are altered, in any direction, in FUSP525L motoneurons (“MASS-SPEC”) and transcripts that are bound in the 3′UTR by endogenous FUSP525L (“3′UTR ENDO”) or exogenous FLAG-FUSP525L (“3′UTR FLAG”). In (d, e), a red box indicates that the Fisher’s exact test p-values are considered significant. Specifically, p < 0.01 for the overlap between INTRON FLAG and MASS-SPEC in (d) and for the overlap between 3′UTR ENDO and MASS-SPEC in (e). Complete list of p-values are reported in Supplementary Fig. S2 online. The drawings have been taken by Maria Giovanna Garone.

