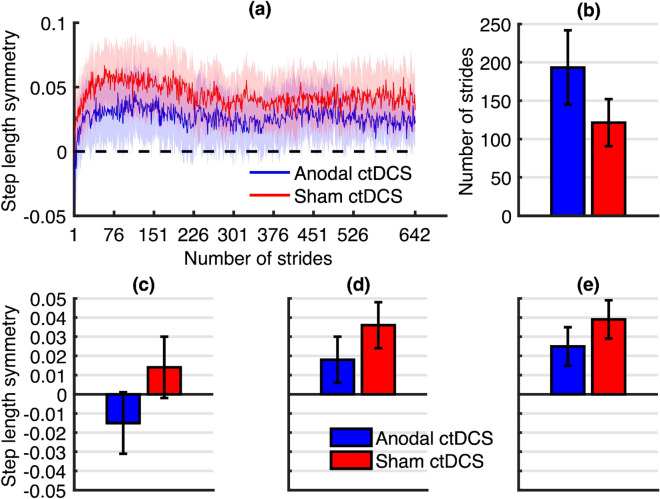
Figure 6.
Graphs illustrating the results of the adaptation phase at the follow-up session. (a) Stride-by-stride mean step length symmetry plot for the anodal ctDCS group (blue) and sham ctDCS group (red) during the adaptation phase of the follow-up session. Lightly shaded areas indicate a 95% confidence interval. The inset bar graphs indicate mean estimates and standard error from the statistical models for (b) the number of strides to steady-state, (c) immediate adaptation, (d) early adaptation, (e) late adaptation.

