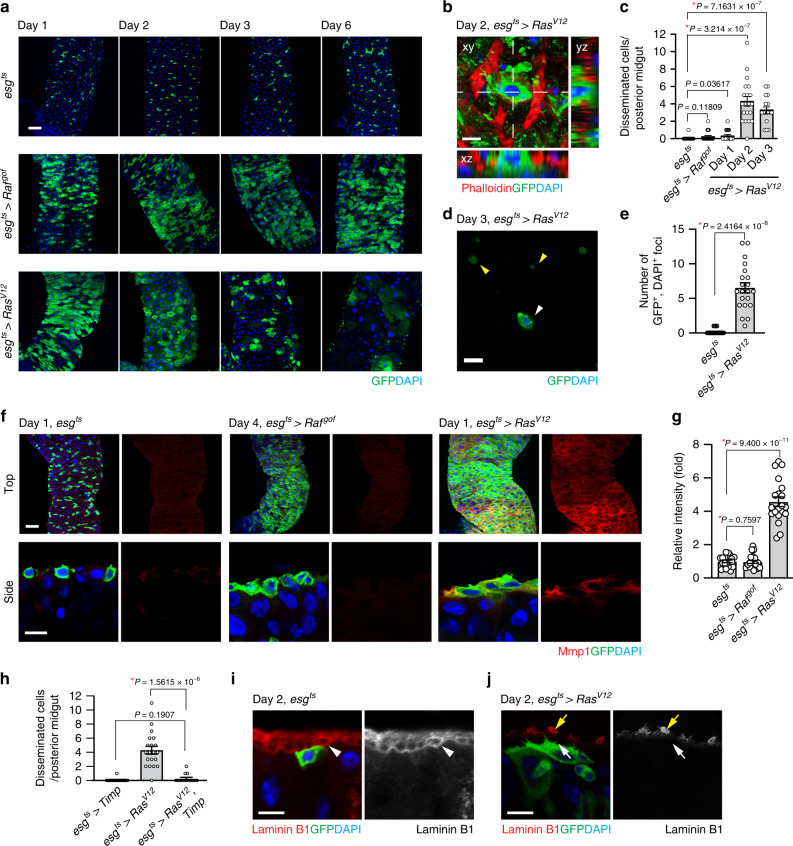
Fig. 1. RasV12 cells basally disseminate from the posterior midgut.
a Images of the posterior midgut. Transgenes were induced with esgts by incubating at 29 °C for indicated durations. The cells manipulated by esgts are marked and stained with GFP (green), and nuclei are stained with DAPI (blue). Scale bar, 50 µm. b Representative image of disseminated cell. Top view (xy) and orthogonal views (yz and xz) are shown. Phalloidin (red) visualizes VM. Scale bar, 10 µm. c Quantification of disseminated cells detected on the surface of posterior midgut. N = 25 (esgts), N = 20 (esgts > Rafgof), N = 21 (day 1, esgts > RasV12), N = 20 (day 2, esgts > RasV12), N = 16 (day 3, esgts > RasV12) biological replicates. d Representative image of GFP+ and DAPI+ cell (white arrowhead) detected in hemolymph. RasV12 was expressed with esgts for 3 days before hemolymph collection. GFP+ and DAPI– particles (yellow arrowheads) were also detected. Scale bar, 10 µm. e Quantification of circulating GFP+ and DAPI+ cells. N = 3 independent experiments for each genotype. f Mmp1 immunostaining (red) in posterior midguts. Lower panels show side view of the cells. Scale bars, 50 µm (top) and 10 µm (bottom). g Quantification of Mmp1 levels. N = 20 data points collected from seven biological replicates for each genotype. h Quantification of disseminated cells detected on the surface of posterior midgut. N = 16 (esgts > Timp), N = 20 (esgts > RasV12), N = 14 (esgts > RasV12, Timp) biological replicates. I–j Laminin B1 staining of midguts. esgts and esgts > RasV12 midguts were stained with anti-laminin B1 antibody. White arrowhead in the esgts image points to the inner laminin layer adjacent to the epithelium, white arrow in the esgts > RasV12 images points the boundary of the epithelium where laminin is degraded, and yellow arrow in the esgts > RasV12 images points to a patchy laminin signal outside VM. Scale bar, 10 µm. In the side views, the basal side of epithelia is positioned upward. In (c), (e), (g), and (h), mean ± SEMs are shown with individual data points. Data were analyzed by two-tailed unpaired Student’s t-test. Asterisks indicate statistical significance (*P < 0.01) and P values are indicated in graph.

