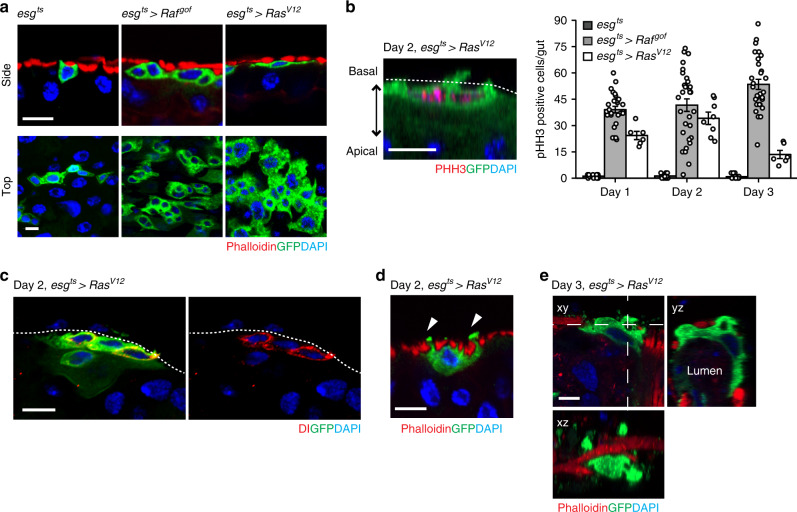
Fig. 2. Disseminating RasV12-transformed cells undergo extensive remodeling of cell morphology.
a Representative cell morphologies from side and top view. Transgenes were induced for 1 day. Phalloidin signal visualizes VM (red). Scale bars, 10 µm. b Representative image of pHH3 (red) staining of RasV12 cells and quantification of phospho-histone H3 (pHH3) cells per midgut after 3 days of expression. Prior to staining, RasV12 was expressed for 2 days. Dotted line indicates the epithelial boundary. Scale bars, 10 µm. For quantification, day 1: N = 16 (esgts), N = 27 (esgts > Rafgof), N = 6 (esgts > RasV12); day 2: N = 14 (esgts), N = 31 (esgts > Rafgof), N = 8 (esgts > RasV12); day 3: N = 16 (esgts), N = 29 (esgts > Rafgof), N = 6 (esgts > RasV12) biological replicates. Data are mean ± SEMs. c Delta (Dl) antibody staining. The Notch receptor ligand Dl—a marker of intestinal stem cells—was detected in RasV12 cells. Dotted line indicates the epithelial boundary. RasV12 cells are marked with GFP (green), and nuclei are stained with DAPI (blue). Scale bar, 10 µm. d Side view of RasV12 cell. RasV12 was induced for 2 days with esgts. Arrowheads point to protrusions formed across VM. Scale bar, 10 µm. e Side (xy) and orthogonal (yz and xz) views of RasV12 cell. RasV12 was expressed for 3 days. Scale bar, 10 µm.

