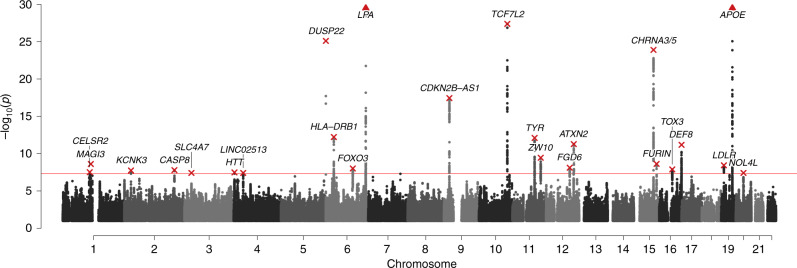
Fig. 2. Twenty-four multivariate loci identified at genome-wide significance.
Manhattan plot showing the nominal strength of association −log10(P value) (two-sided) on the y-axis against the chromosomal position of SNPs on the x-axis, where the null hypothesis is no association with healthspan, parental lifespan, and longevity. The red line represents the genome-wide significance threshold (5 × 10⁻⁸). Annotated are the nearest gene(s) to the lead SNP (in red) of each locus. The y-axis has been capped at 5 × 10⁻³⁰ to aid legibility; SNPs passing this cap are represented as triangles: LPA, P = 3.8 × 10⁻³⁰, APOE, P = 9.6 × 10−127.

