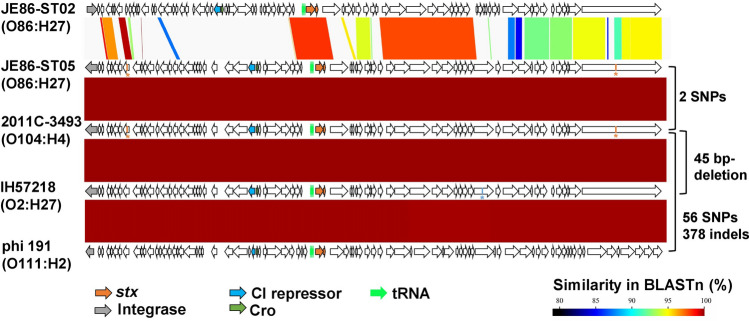
Figure 3.
Comparison of the complete sequence of the Shiga toxin (Stx) 2a phage of Stx-enteroaggregative E. coli O86:H27, O104:H4, hybrid Shigatoxigenic and enterotoxigenic E. coli O2:H27, and O111:H2. Arrows represent the CDSs, and major genes are coloured as shown in the legend. BLASTn and visualization were performed with GenomeMatcher software. The number of single nucleotide polymorphisms (SNPs) and insertions and deletions (indels) to the phage of O104:H4 are shown on the right. Red and blue asterisks show the position of SNPs and deletion, respectively, compared to the phage of O104:H4.

