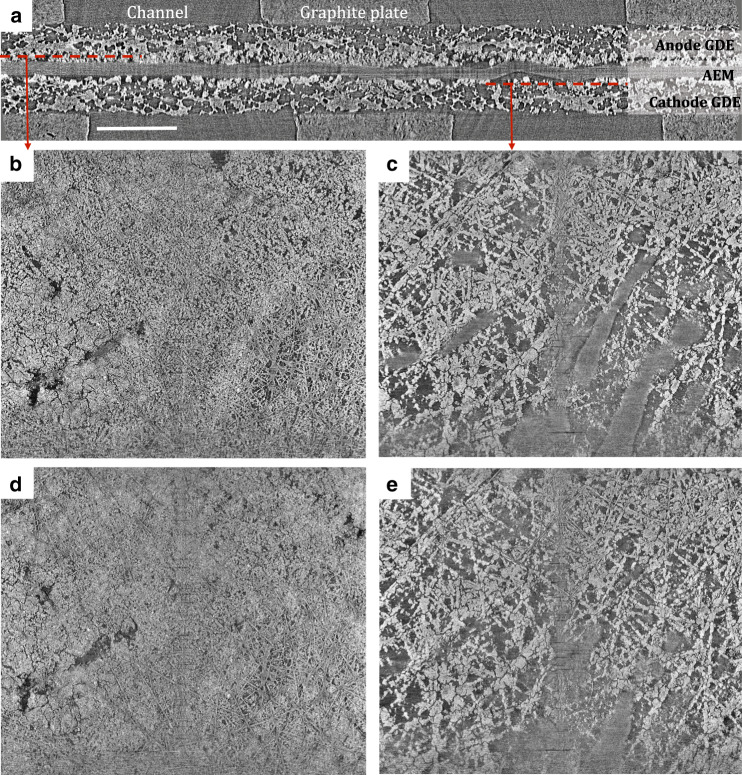
Fig. 7. Morphology of electrodes with added PTFE.
AMFC micro X-ray computed tomography images: (a) cross-section of the MEA showing the position of anode GDE, AEM, and cathode GDE of the imaged area; scale bar = 500 μm, (b), (c) longitudinal sections of anode and cathode GDEs at OCV under 100% RHs, (d), (e) longitudinal sections of anode and cathode GDEs at 0.1 V under 100% RHs. The anode and cathode used in this measurement contained 20% wt PTFE in the GDLs and 8% wt PTFE in the CLs. The anode and cathode loading were 0.70 mgPtRu cm−2 and 0.60 mgPt cm−2, respectively. H2/O2 reacting gases were both fed to the cell at 200 sccm.

