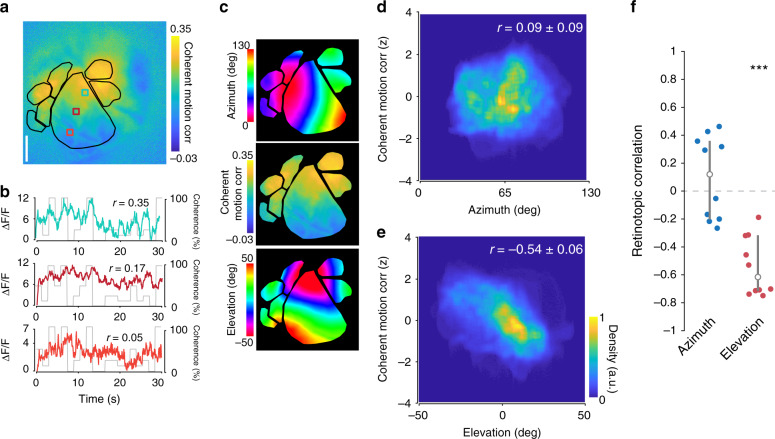
Fig. 4. Retinotopic asymmetry of coherent motion correlations across the visual cortex.
a Map from single experiment showing gradient of coherent motion correlation along the vertical retinotopic axis of V1. b Single pixel responses from anterior (blue, r = 0.35), middle (red, r = 0.17), and posterior (orange, r = 0.05) pixels in V1, showing different amounts of coherent motion correlation. c Visual cortex isolated maps from mouse in (a) of azimuth (top) and elevation (bottom), as well as the coherent motion correlation (middle) for comparison. d Density scatter plot across all mice (n = 10 sessions over 10 mice), showing no significant correlation to azimuth (r = 0.09 ± 0.09). Coherent motion correlation is z-scored to account for differences between experiments. e Same as (d), but for elevation, showing a significant negative correlation between elevation preference and coherent motion correlation across visual cortex (r = −0.54 ± 0.06, p = 1.9 × 10⁻⁵, two-tailed single-sample t test). f Comparison of retinotopic correlation between azimuth and elevation. There is a significant anticorrelation of coherent motion correlation and elevation across mice, but none with azimuth (p = 1.9 × 10⁻⁵, two-tailed single-sample t test. Error bars are median ± quartiles (***p < 0.001).

