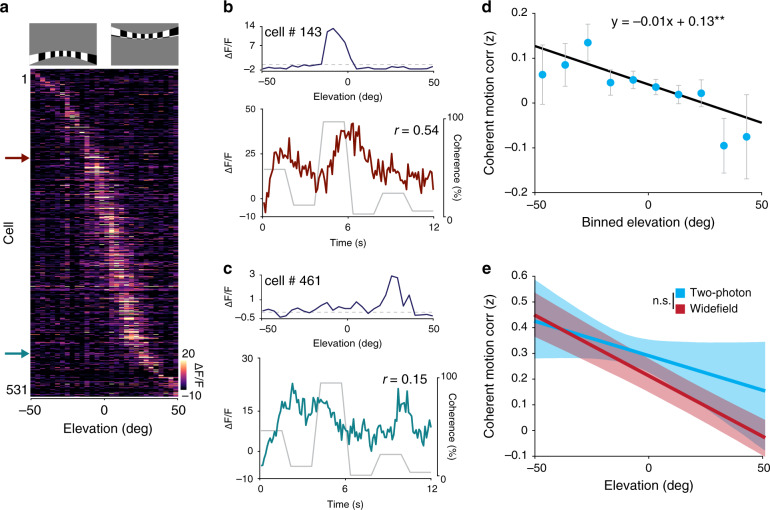
Fig. 7. Retinotopic asymmetry of single-cell coherent motion correlations in V1.
a Top: examples of a high elevation and low elevation spherically corrected retinotopic bar stimulus. Bottom: averaged responses of each cell in the field to the elevation retinotopic bar stimulus, ordered by elevation preference. b, c Top: the preferred elevation location of the specified cell. Bottom: the calcium response of the cell during the RDK stimulus, with the coherence trace overlaid. d Plot of elevation preference versus z-scored coherent motion correlation with neurons averaged within 10° elevation bins (n = 2680 cells from 13 mice). Error bars are mean ± s.e.m. e Plot of mean elevation preference versus coherent motion correlation averaged across experiments for wide-field (red) and two-photon experiments (blue). The confidence band represents the bootstrapped 95% confidence intervals of the slope and intercept (wide field vs. two-photon: p = 0.51, two-tailed unpaired two-sample t test). **p < 0.01.

