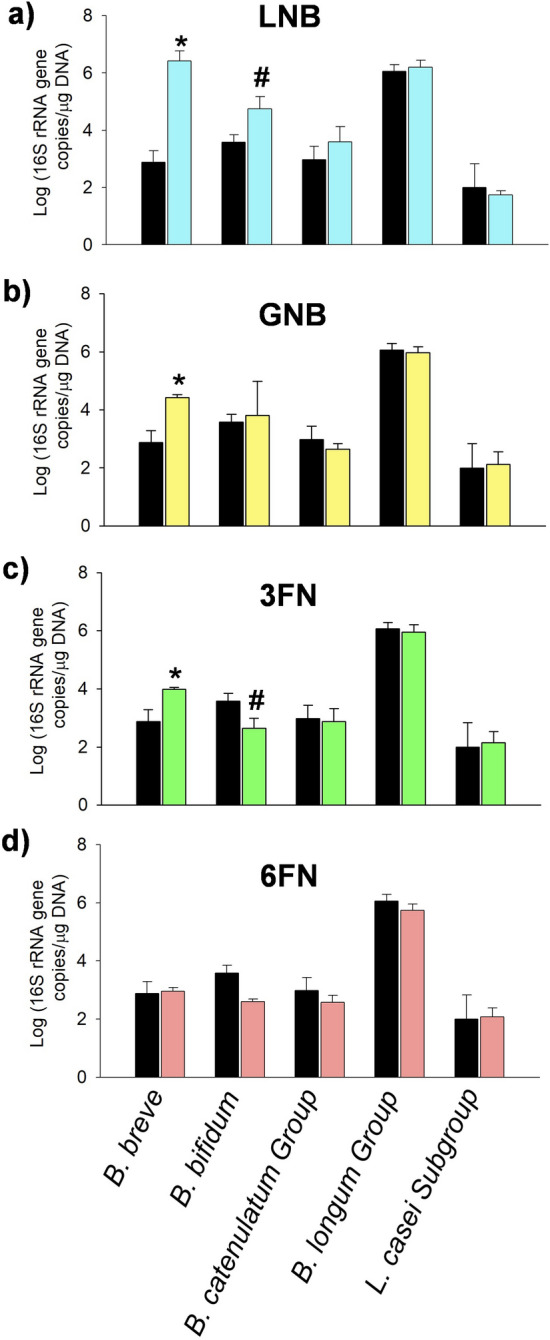
Figure 2.

Bifidobacterium species/groups and Lactobacillus casei group levels measured with qPCR in cultures with fecal infant microbiota supplemented with oligosaccharides (clear bars). (a) lacto-N-biose (LNB); (b) galacto-N-biose (GNB); (c) fucosyl-α-1,3-N-acetylglucosamine (3FN); (d) fucosyl-α-1,6-N-acetylglucosamine (6FN). Control cultures are without carbohydrate added (dark bars). In all graphs, the data of the control is represented for better comparison. Data presented are mean values based on at least three replicates. Error bars indicate standard deviations. Statistically significant differences compared to control are indicated: #p < 0.1; *p < 0.05.
