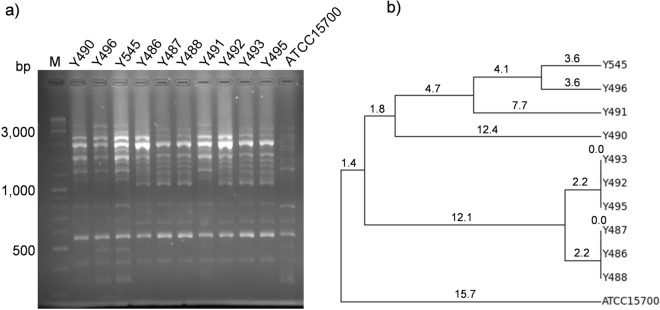
Figure 3.
Evaluation of the genetic diversity among the Bifidobacterium breve strains isolated in this study using RAPD-PCR analysis. Agarose gel (2%) electrophoresis (a) and cluster analysis (b) of the DNA band patterns obtained from the B. breve strains Y486, Y487, Y488, Y490, Y491, Y492, Y493, Y495, Y496 and Y545. The type strain B. breve ATCC15700 was used as control. Cluster analysis was performed using the unweight pair group method with arithmetic mean (UPGMA) analysis. The numbers in the dendrogram provide a measure of genetic distances between isolates. Lane M, DNA molecular weight marker.

