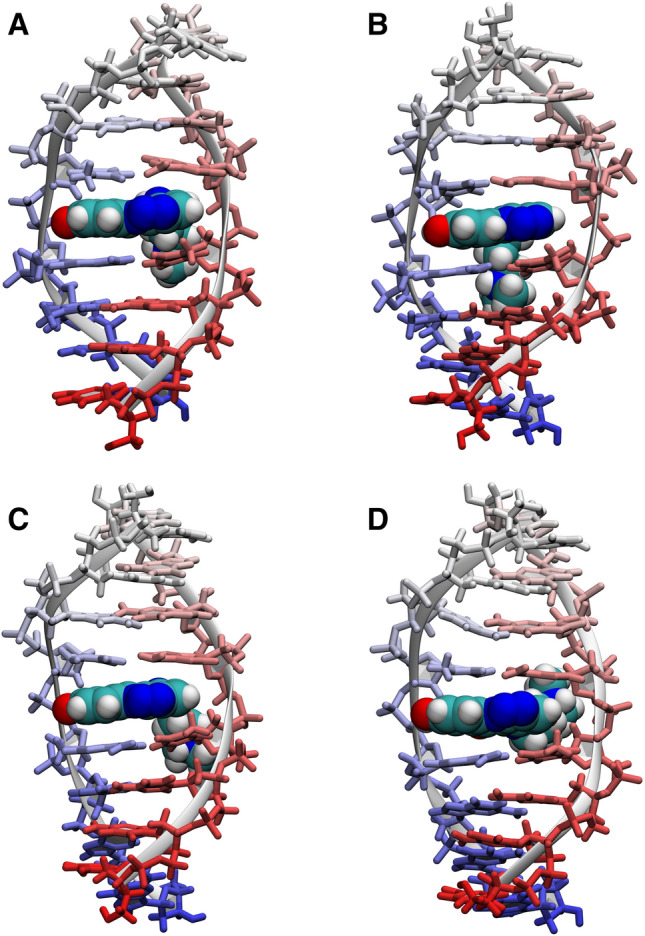
Figure 5.

The most representative structures of the D2L and D3L complexes, obtained as centres of the dominant conformational clusters from the four molecular dynamics simulations: (A) D2L-MD1 (restrained), (B) D2L-MD2 (unrestrained), (C) D3L-MD1 (restrained), (D) D3L-MD2 (unrestrained). For more details on clustering, please consult Supplementary Information. This figure was prepared using VMD 1.9.340, https://www.ks.uiuc.edu/Research/vmd.
