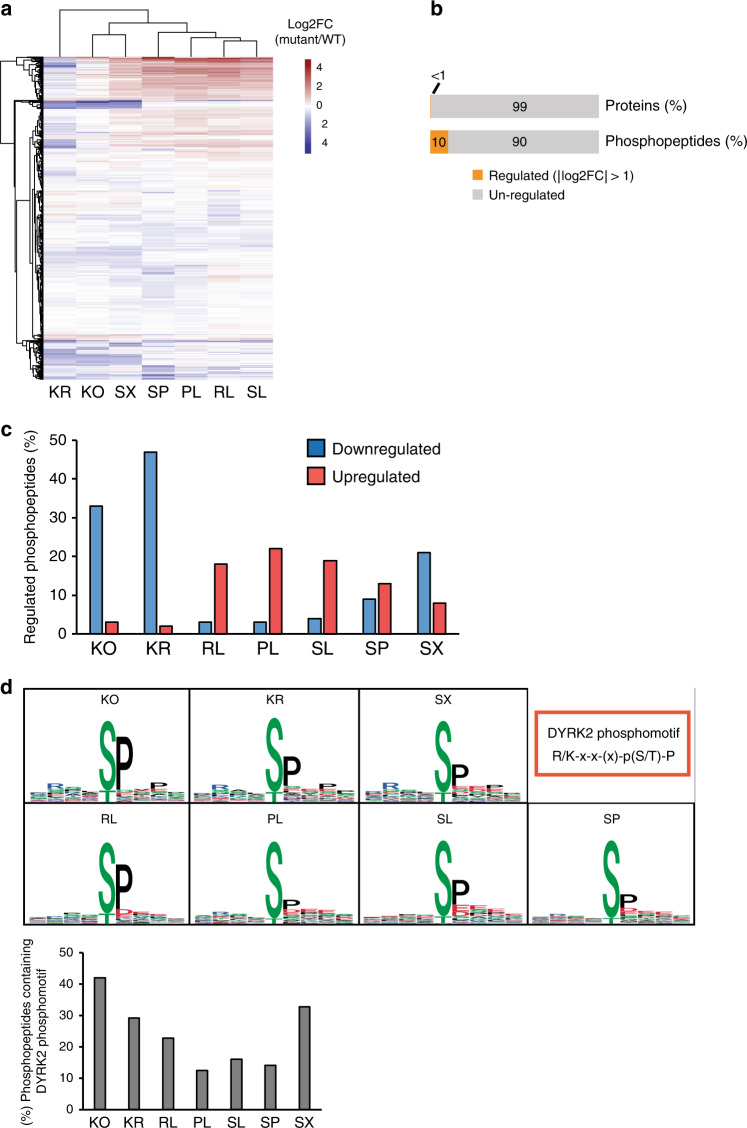
Fig. 6. The molecular footprint of Dyrk2 cancer-related mutations on the cellular phosphoproteome.
a Heatmap with hierarchical clustering illustrating changes in the abundance of cellular phosphopeptides across the different cancer-related Dyrk2 point mutants. Only those peptides that have been detected at least once as statistically significantly changed (adj. p-value ≤ 0.01, │log2FC│ > 0.5) are displayed. b Content of regulated proteins and phosphopeptides summarized from all Dyrk2-mutant cell lines (regulated phosphopeptides:│log2FC│ > 1, adj. p-value ≤ 0.05). c Fraction of significantly upregulated or downregulated localized phosphopeptides in cell lines expressing the Dyrk2 point mutants (│log2FC│ > 1, adj. p-value ≤ 0.05). d Phosphomotif analysis of downregulated phosphopeptides in the different Dyrk2 variants (adj. p-value ≤ 0.05) (left panel). Fraction of downregulated phosphopeptides containing the Dyrk2 phosphomotif (right panel). The statistical analysis and p-value calculation (adj. p-value (FDR)) was performed within the mapDIA package60. Source data are provided as source data file.

