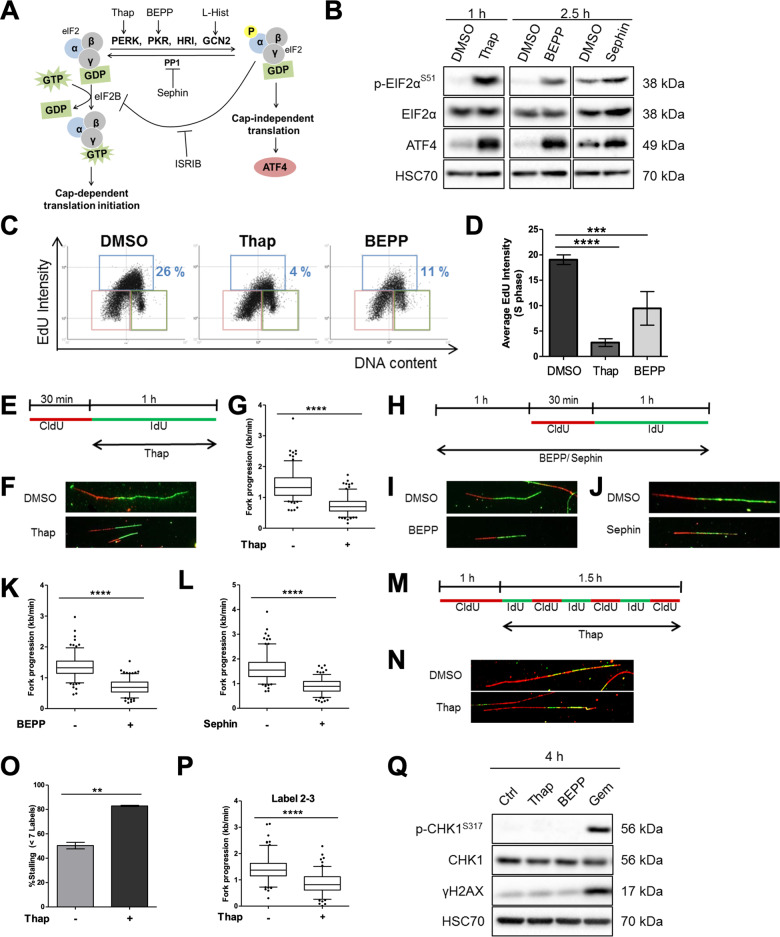
Fig. 1. DNA replication is compromised shortly after ISR induction.
a Schematic representation of the ISR that can be activated upon stimulation of the kinases PERK, PKR, or GCN2 or upon inhibition of the phosphatase PP1 using thapsigargin, BEPP-monohydrochloride, l-Histidinol or Sephin, respectively. Activation of ISR can be measured by an increase in eIF2alpha phosphorylation or by the accumulation of ATF4. ISR can be inhibited using a small molecule inhibitor, ISRIB. b Immunoblot analysis of cells treated with Thap (4 μM), BEPP (10 μM), or Sephin (25 μM) to confirm ISR induction. HSC70 as loading control. c Representative horseshoe plots showing EdU incorporation in relation to DNA content (DAPI) of cells treated with DMSO, Thap (4 μM, 1 h) or BEPP (10 μM, 2.5 h). The different gates are highlighted as follow: G1 (pink), S (blue), G2/M (green). The percentage of S phase cells is indicated for the respective treatments. d Average EdU staining intensity of cells in S phase as determined from the plots in c and displayed as mean ± SD. For second replicate, see Supplementary Fig. S1B. e U2OS cells were incubated with 5′-chloro-2′-deoxyuridine (25 μM CldU, 30 min) followed by 5-iodo-2′-deoxyuridine (250 μM IdU, 60 min) in the presence of 4 μM Thap prior to harvesting for DNA fiber analysis. f Representative labeled tracks of newly synthesized DNA incorporating CldU (red) and IdU (green) of cells in e. g Fork progression as determined from IdU track length (kb/min), displayed as 5–95 percentile whiskers box plot of Thap-treated cells. Box plots represent data from one out of three independent experiments. See Supplementary Fig. S1C, D for additional experiments. h U2OS cells were pre-treated with 10 μM BEPP or 25 μM Sephin for 1 h and subsequently incubated with CldU (30 min) and IdU (60 min) in the presence of these reagents and then harvested for analysis. i, j Representative fiber tracks as visualized by immunostaining of CldU (red) and IdU (green) of BEPP (i) or Sephin (j)-treated cells. k, l Fork progression calculated from the IdU label (kb/min) of BEPP (k) or Sephin (l)-treated cells. Fork progression displayed as boxplots with 5–95 percentile whiskers, which are representative of one out three independent experiments. See Supplementary Fig. S1E–H. m Cells were pulsed labeled with CldU (25 μM, 60 min) and then alternately with IdU (25 μM) and CldU (25 μM) for 15 min intervals for a duration of 1.5 h in the presence of Thap (4 μM), then harvested for 7-label fiber assay analysis9. From this, the number of labels incorporated was used for fork stalling analysis and the length of labels 2–3 was used for fork progression analysis. n Representative images of fiber tracks that have incorporated 7 labels. o Percentage of forks with less than 7 labels indicating higher fork stalling rate of cells treated with Thap. Chart represents mean ± SD of two independent experiments. p Velocity of fork determined from track length of labels 2 to 3 displayed as box plots (5–95 percentile whiskers). Plot is a representative of two independent experiments. See Supplementary Fig. S1M. q Cells were treated with Thap (4 μM), BEPP (10 μM) or Gem (500 nM) for 4 h and then harvested for western blot analysis. DNA damage signaling was evaluated through Chk1 phosphorylation and gamma H2AX induction. Total Chk1 levels and HSC70 were used as loading controls. Gemcitabine treatment was included as a positive control.

