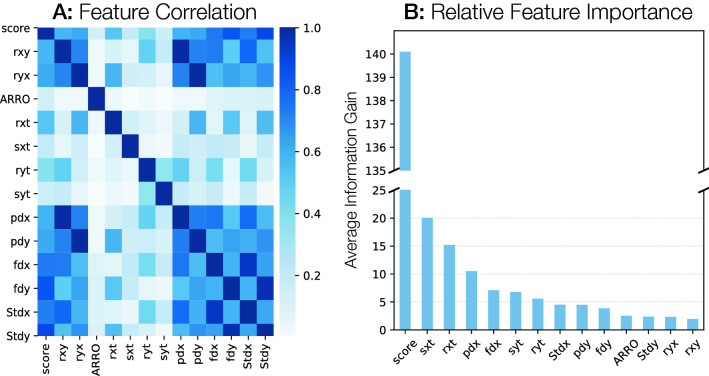
Figure 5.
Exploration of RPmirDIP Features. (A) is a heatmap of feature correlation. Notably, the ARRO metric is the least correlated with other features and, as expected, rank (rxy, ryx) are strongly correlated with percent difference (pdx, pdy), respectively. (B) Plots the gain of a given feature as indicative of the relative contribution of that feature to the model based upon the feature’s contribution to each tree in the model. Note the break in the y-axis due to the large relative information gain on the initial score. Formally, gain is the average reduction in training loss when selecting that feature for splitting.

