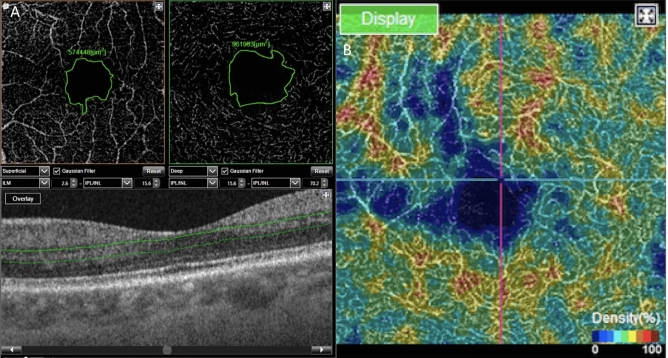
Figure 1.
(A) Manual measurement of the foveal avascular zone (FAZ). On the left, at the superficial capillary plexus (SCP) level, and on the right, at the deep capillary plexus (DCP) level. The limits of the FAZ are in green. Below, B-scan with the limits of segmentation of the DCP in green. (B) Example of colorimetric representation of the vascular density in the DCP used for subjective evaluation of the location of blood flow loss. In blue the lower densities, and in red the higher densities.

