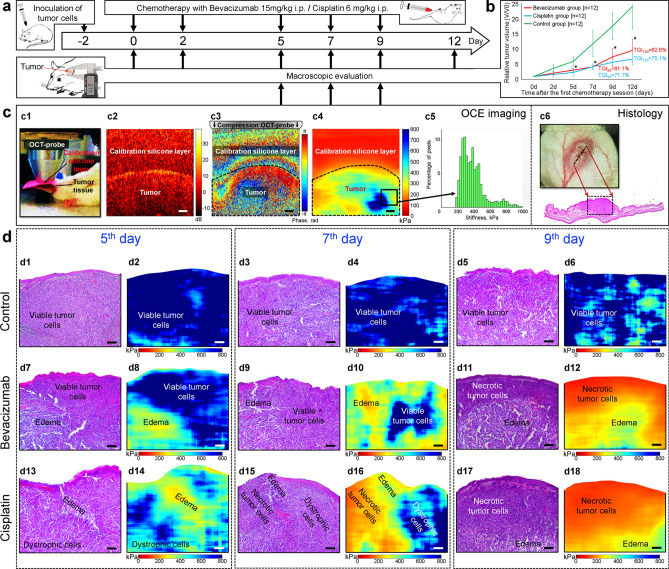
Figure 1.
Experimental design, schematically shown OCE-procedures and preliminary results of OCE/histology comparison. (a) Experimental time course. Two days before treatment started (day-2) tumor cells were inoculated into the ear skin. Chemotherapy was started on day 0 and continued on days 2, 5, 7 and 9. For days 0–12 tumor volume changes were monitored macroscopically using repeated caliper measurements. OCE imaging was carried out on days 5, 7 and 9. Tumor resection for histological assessment was performed at the OCE time points in three animals to validate the in vivo observations. (b) Kinetics of tumor growth under chemotherapy with Bevacizumab and Cisplatin; the arrows indicate the time point of drug administration; *Significant differences from the control group (p < 0.05) noted in the Bevacizumab and Cisplatin groups. (c) Elucidation of experimental OCE procedures for imaging of tumor. OCT probe pressing onto the studied sample, structural OCT B-scan of cancerous tissue under reference silicone, inter-frame phase variation, OCE image and histogram showing the stiffness spectrum (histogram showing percentage of pixels with a particular stiffness value) over a selected region of the OCE image. (d) Representative examples of parallel monitoring of tumor evolution during chemotherapy by conventional histological examination (left columns) and the stiffness maps obtained by OCE method (right columns) that will be segmented as explained below. Scale bar for all images = 100 μm.

