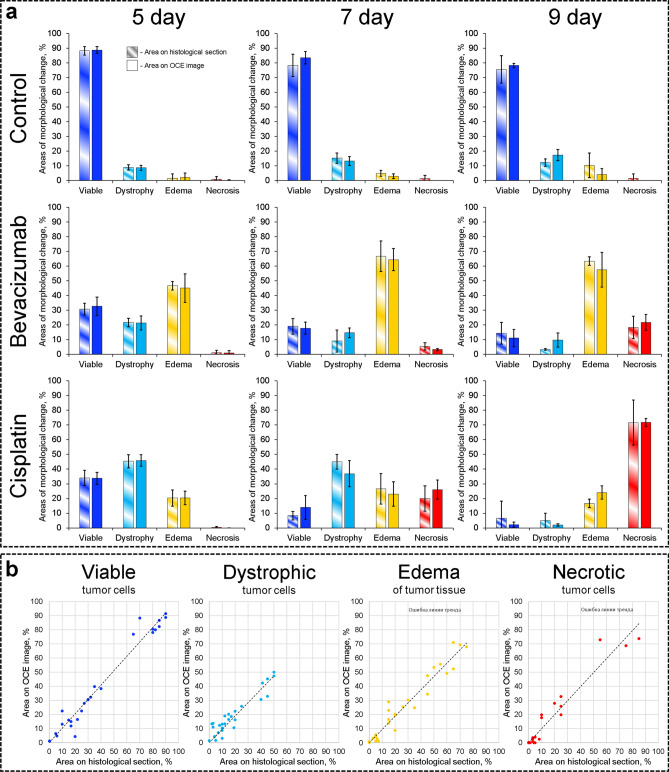
Figure 3.
Quantitative comparison of histological and OCE-based segmentation results. (a) Comparison of the results of histological examination (striped columns) and OCE monitoring (monotone columns). (b) Relationship between the amount of space occupied by each allocated tumor zone and the percentage of the areas on the OCE images with a stiffness value in the range of this tumor zone. A strong and direct correlation is visible (Pearson correlation coefficient for viable tumor cells r = 0.98, for dystrophic tumor cells r = 0.94, for edema r = 0.97, for necrotic tumor cells r = 0.97).

