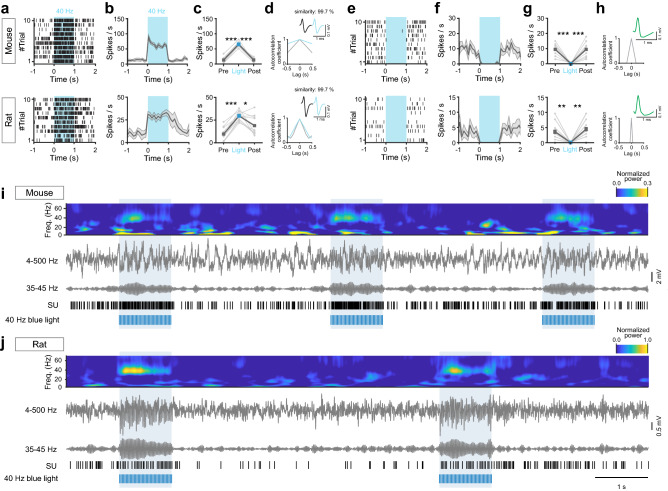
Figure 7.
Optogenetics in conjunction with chronic single-unit and LFP recordings. (a–h) Optogenetic manipulation of ChR2-expressing mPFC PV interneurons in PV-Cre mice and PV-Cre rats. Top: mouse, bottom: rat. (a–d) Light-activated mPFC PV interneurons. (a) Spike raster of an example light-responsive PV interneuron responding to 40 Hz blue light (473 nm, 1 s, 3 ms pulses) application with significantly increased spiking. (b, c) Average modulation of the neuron in (a) across 10 trials. (d) Temporal structure of the spiking of the neuron in (a–c). Inset: The average spike waveform of the recorded neuron. Spontaneous (gray) and light-evoked (blue) action potential waveforms exhibit very high similarity. (e–h) Concurrently recorded WS putative excitatory neurons in the local mPFC circuitry. (e) Spike raster of an example WS neuron demonstrating significantly decreased spiking in response to light-activation of local PV interneurons. (f, g) Average modulation of the neuron in (e) across 10 trials. (h) Temporal structure of the spiking of the neuron in (e–g). Inset: The average spike waveform of the recorded neuron. (i, j) Optogenetic manipulation of ChR2-expressing mPFC PV interneurons. Spectrogram (4–70 Hz), raw LFP (4–500 Hz), band-pass filtered LFP (35–45 Hz), and single-unit (SU) activity from mPFC recordings (10 s) in freely moving PV-Cre mice (i) and PV-Cre rats (j). Blue light application (473 nm, 1 s, 40 Hz, 3 ms pulses) results in increased oscillatory activity in the gamma range as seen in the LFP. Same SUs as in (a). Shaded area and error bars: ± SEM. *p < 0.05, **p < 0.01, ***p < 0.001 by paired t-test.

