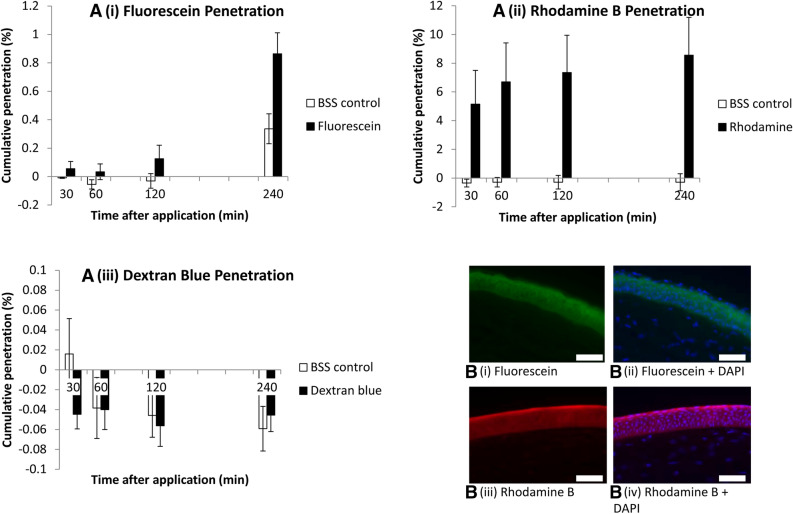
Figure 2.
Ex vivo porcine corneal permeability to fluorescein (A i), rhodamine B (A ii) and dextran blue (A iii). Results are displayed as bar charts with mean and standard error (error bars). (B i–iv) fluorescent microscopy images of anterior stroma and epithelium after fluorescein (B i, ii) and rhodamine B (B iii, iv) application, without (B i, iii) and with (B ii, iv) DAPI staining of cell nuclei. Scale bar 100 µm. Graphs represents data from 3 independent experiments for rhodamine, 4 repeats for fluorescein and 5 repeats for dextran blue.

