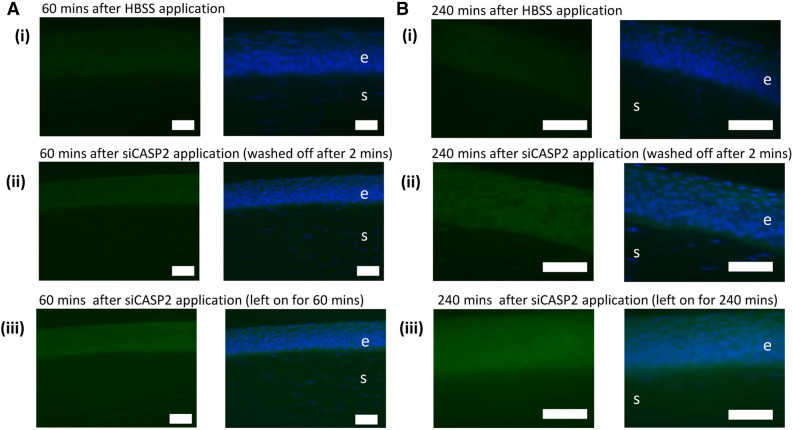
Figure 6.
siCASP2 adsorption to the corneal epithelium demonstrated by FISH staining. 10 µg siCASP2 was applied to the corneal surface and left on for the duration of the experiment (A) or washed off after 2 min (B) to simulate lacrimal drainage. Green staining represents siCASP2 and blue represents DAPI (nucleic acid) staining. Background fluorescence is seen in (A i) and (B i) images of cornea 60 and 240 min after HBSS application. “e” marks corneal epithelium; “s” marks corneal stroma; scale bar 50 µm.

