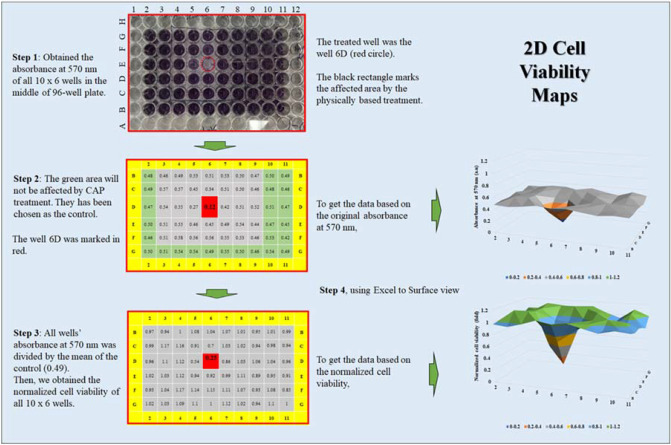
Figure 2.
The protocols to make a 2D cell viability assay map based on a 96-well plate. The photo of a 96-well plate after the MTT assay was used here as an example. To get the map reflecting the original absorbance at 570 nm, the original data were used. To obtain the map reflecting the normalized data, the original data would be divided by the mean value of the control group. The data used to draw the 2D maps was the mean of the repeated tests. Each well’s data were based on the mean value of the corresponding well’s data in different repeats. The standard deviation (s.d.) of each well was also obtained, if needed, they could be shown in 2D maps based on s.d.

