FIGURE 2.

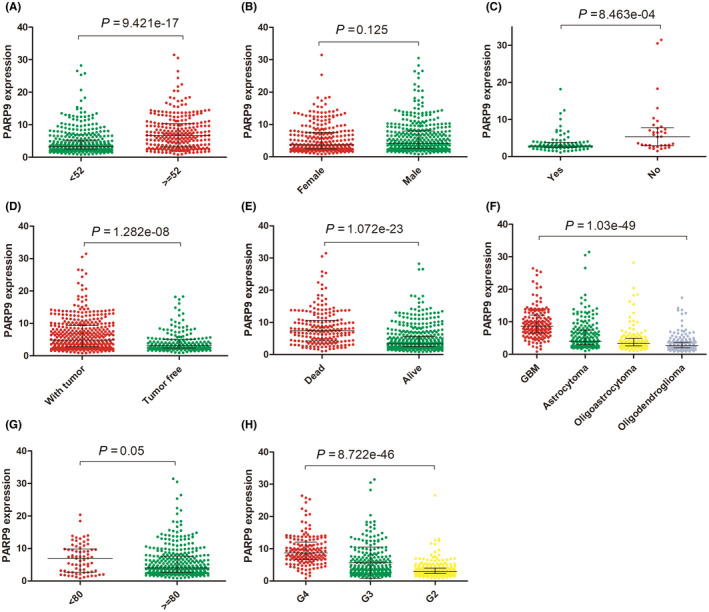
Relationship between the expression of PARP9 and clinicopathologic features in TCGA cohort. (A): age, (B): gender, (C): IDH mutation, (D): tumor status. (E): vital status, (F): histological type, (G): KPS, (H): grade

Relationship between the expression of PARP9 and clinicopathologic features in TCGA cohort. (A): age, (B): gender, (C): IDH mutation, (D): tumor status. (E): vital status, (F): histological type, (G): KPS, (H): grade