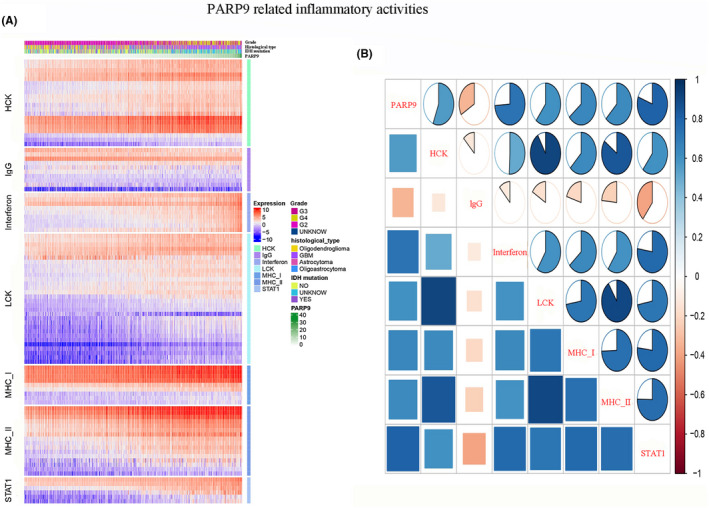
FIGURE 5.

PARP9‐related inflammatory response. A, Heat map involved the clinicopathological features, PARP9 expression, and seven related metagenes from the TCGA datasets. B, Correlograms were generated based on the relationship between PARP9 expression and GSVA enrichment scores for these seven metagenes. The circles were filled in blue clockwise for positive values and in red anticlockwise for negative values
