Fig. 1.

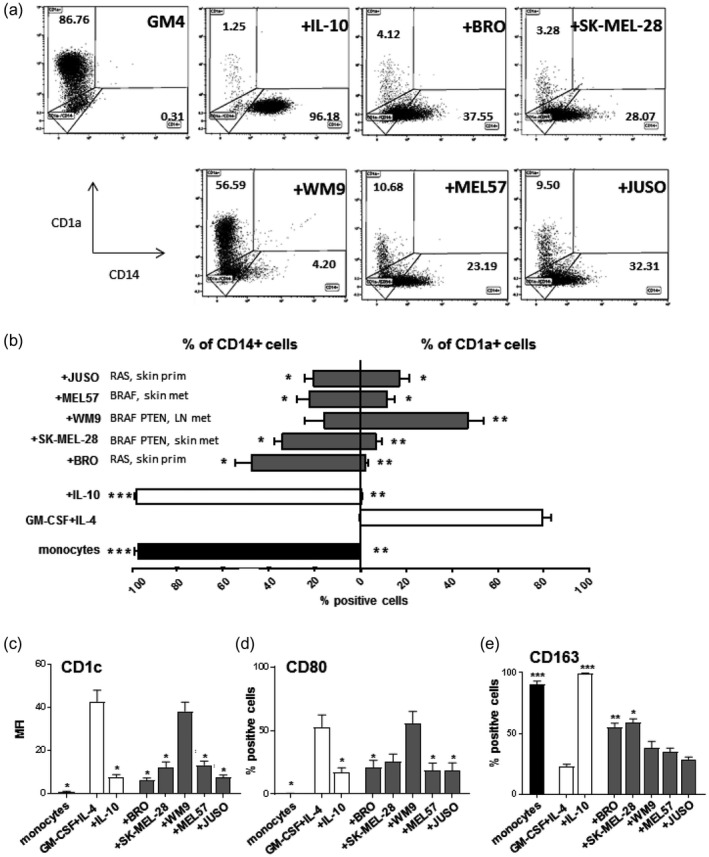
Melanoma cell lines suppress monocyte‐derived dendritic cell (moDC) differentiation. Monocytes were phenotyped at day 0 or cultured for 6 days under different conditions and phenotyped after culture. (a) Representative fluorescence activated cell sorter (FACS) dot‐plots showing CD1a versus CD14 expression on moDC under different culture conditions. (b) Average percentages of CD1a+ and CD14+ expressing monocytes or moDC under different culture conditions, n = 3. The conditions shown are: day 0 initial monocytes (monocytes), granulocyte–macrophage colony‐stimulating factor (GM‐CSF)+interleukin (IL)‐4 (GM4), GM‐CSF+IL‐4+IL‐10 (+IL‐10), GM‐CSF+IL‐4+BRO (+BRO), GM‐CSF+IL‐4+SK‐MEL‐28 (+SK‐MEL‐28), GM‐CSF+IL‐4+WM9 (+WM9), GM‐CSF+IL‐4+MEL57 (+MEL57) and GM‐CSF+IL‐4+ JUSO (+JUSO). (c) Average geometric mean intensity of CD1c staining, (d) average percentage of CD80+ cells and (e) average percentage CD163+ cells (M2‐like macrophages) in the different monocyte or conditioned moDC conditions, n = 3. Control day 0 uncultured monocytes are shown in black bars; GM4 and +IL‐10 conditions are represented by white bars; and melanoma‐conditioned moDCs by gray bars. Means ± standard error of the mean (s.e.m.) are shown; statistical significances are shown compared to the GM4 condition, applying a matched RM 1‐way analysis of variance (ANOVA) test with Fisher’s least significant difference (LSD) post‐hoc test. Significance shown as *P < 0·05, **P < 0·01 and ***P < 0·001.
