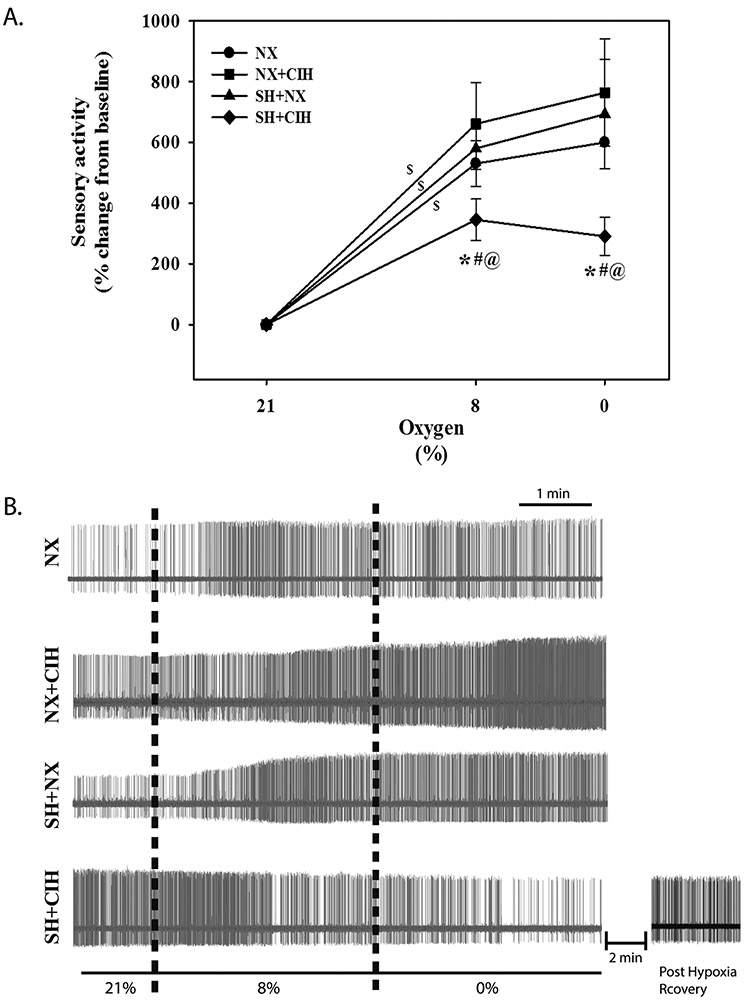
Figure 2.
Hypoxic sensory response of PG cells in NX, CIH, SH, and SH+CIH treated rats. A) average peak response to 8% and 0% O2 for each treatment group (as indicated) and B) representative recordings. Note the attenuated sensory response of SH+CIH treated rats at each level of acute hypoxia and the tendency for it to decrease during 0% as demonstrate in the representative recording in (B) bottom; also shown is the post-hypoxia recording in a SH+CIH cell demonstrating recovery of activity ~2 minutes after return to baseline O2. Values in A) are expressed as a % change from baseline; means ± 1S.E. Vertical dashed lines (B) designate switching to the hypoxic perfusate. *significant difference from NX, #SH, and @CIH treated groups for respective level of bath-applied hypoxia (P<0.05); $significant slope of the response to hypoxia.

