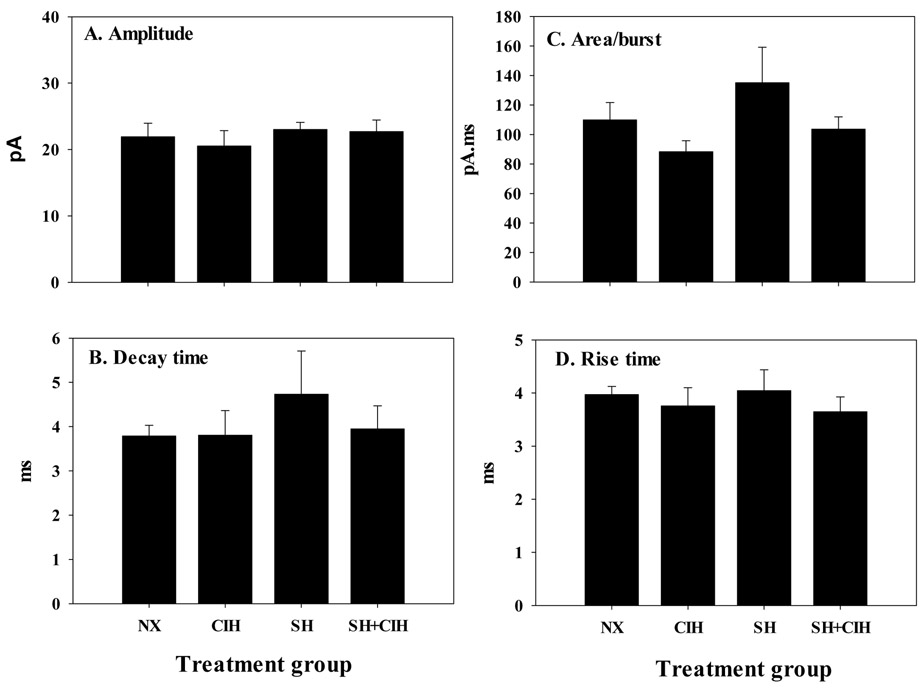
Figure 3.
Average spontaneous excitatory postsynaptic current (EPSC’s) burst amplitude (A), decay time (B), current area (C), and rise time (D) of whole-cell patch clamped in vitro nTS neurons from NX, CIH, SH and SH+CIH treated rats. Note, there were no differences between treatment groups for any of the measured variables. Values for each group are calculated from a 2 sec recording of baseline activity. Values are means ± 1S.E.

