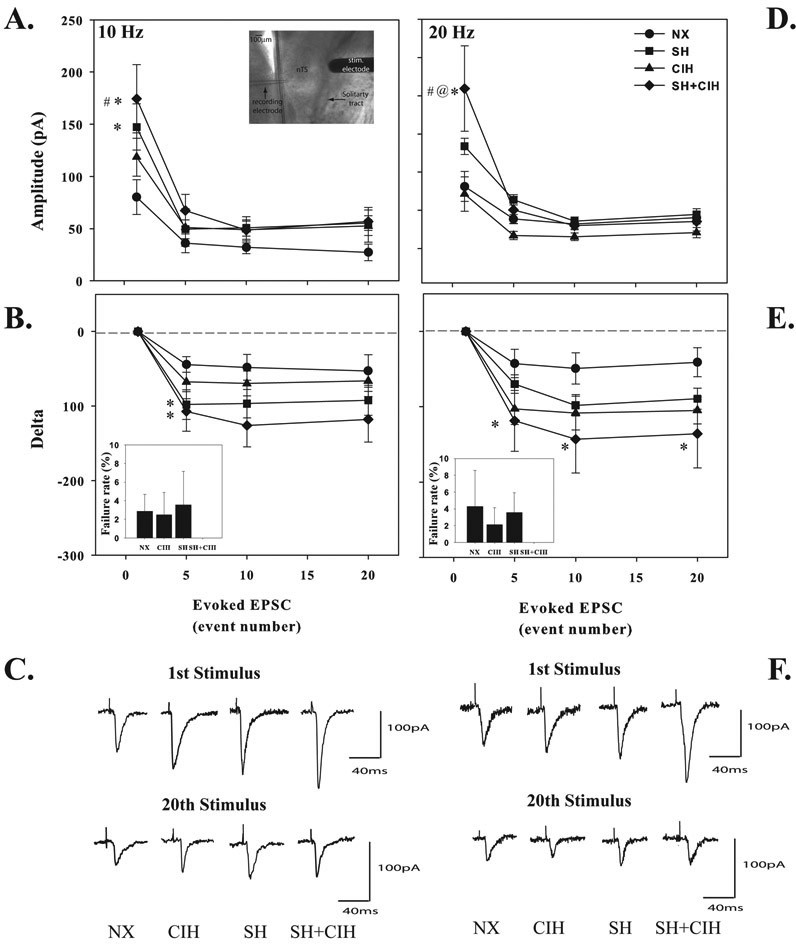
Figure 5.
Average 10Hz (A) and 20Hz (D) evoked EPSC’s burst amplitude of whole-cell patch clamped nTS neurons in NX, CIH, SH and SH+CIH treated rats. Values in B and E are 10Hz and 20Hz evoked EPSC’s expressed as a delta from the first stimulus event to highlight the magnitude of EPSC depression. Note the initial evoked burst amplitude was increased only in SH and SH+CIH treated groups at 10Hz (A), whereas only SH+CIH treated rats exhibited increased evoked responses at 20Hz (D). Neurons from SH+CIH treated rats exhibited the significant EPSC depression (20Hz) compared to cells from NX rats. Representative 10Hz (C) and 20Hz (F) evoked responses for the 1st and last (20th) stimulation event are shown below. Inset: Photo of the recording and stimulating electrode positioned into the nTS region (A) and failure rate for both 10Hz and 20Hz stimulus trains (B and D, inset) . Values are means ± 1S.E.; *significantly different from NX; #significantly different from CIH; @significantly different from SH treated rats within corresponding stimulus event number (P<0.05).

