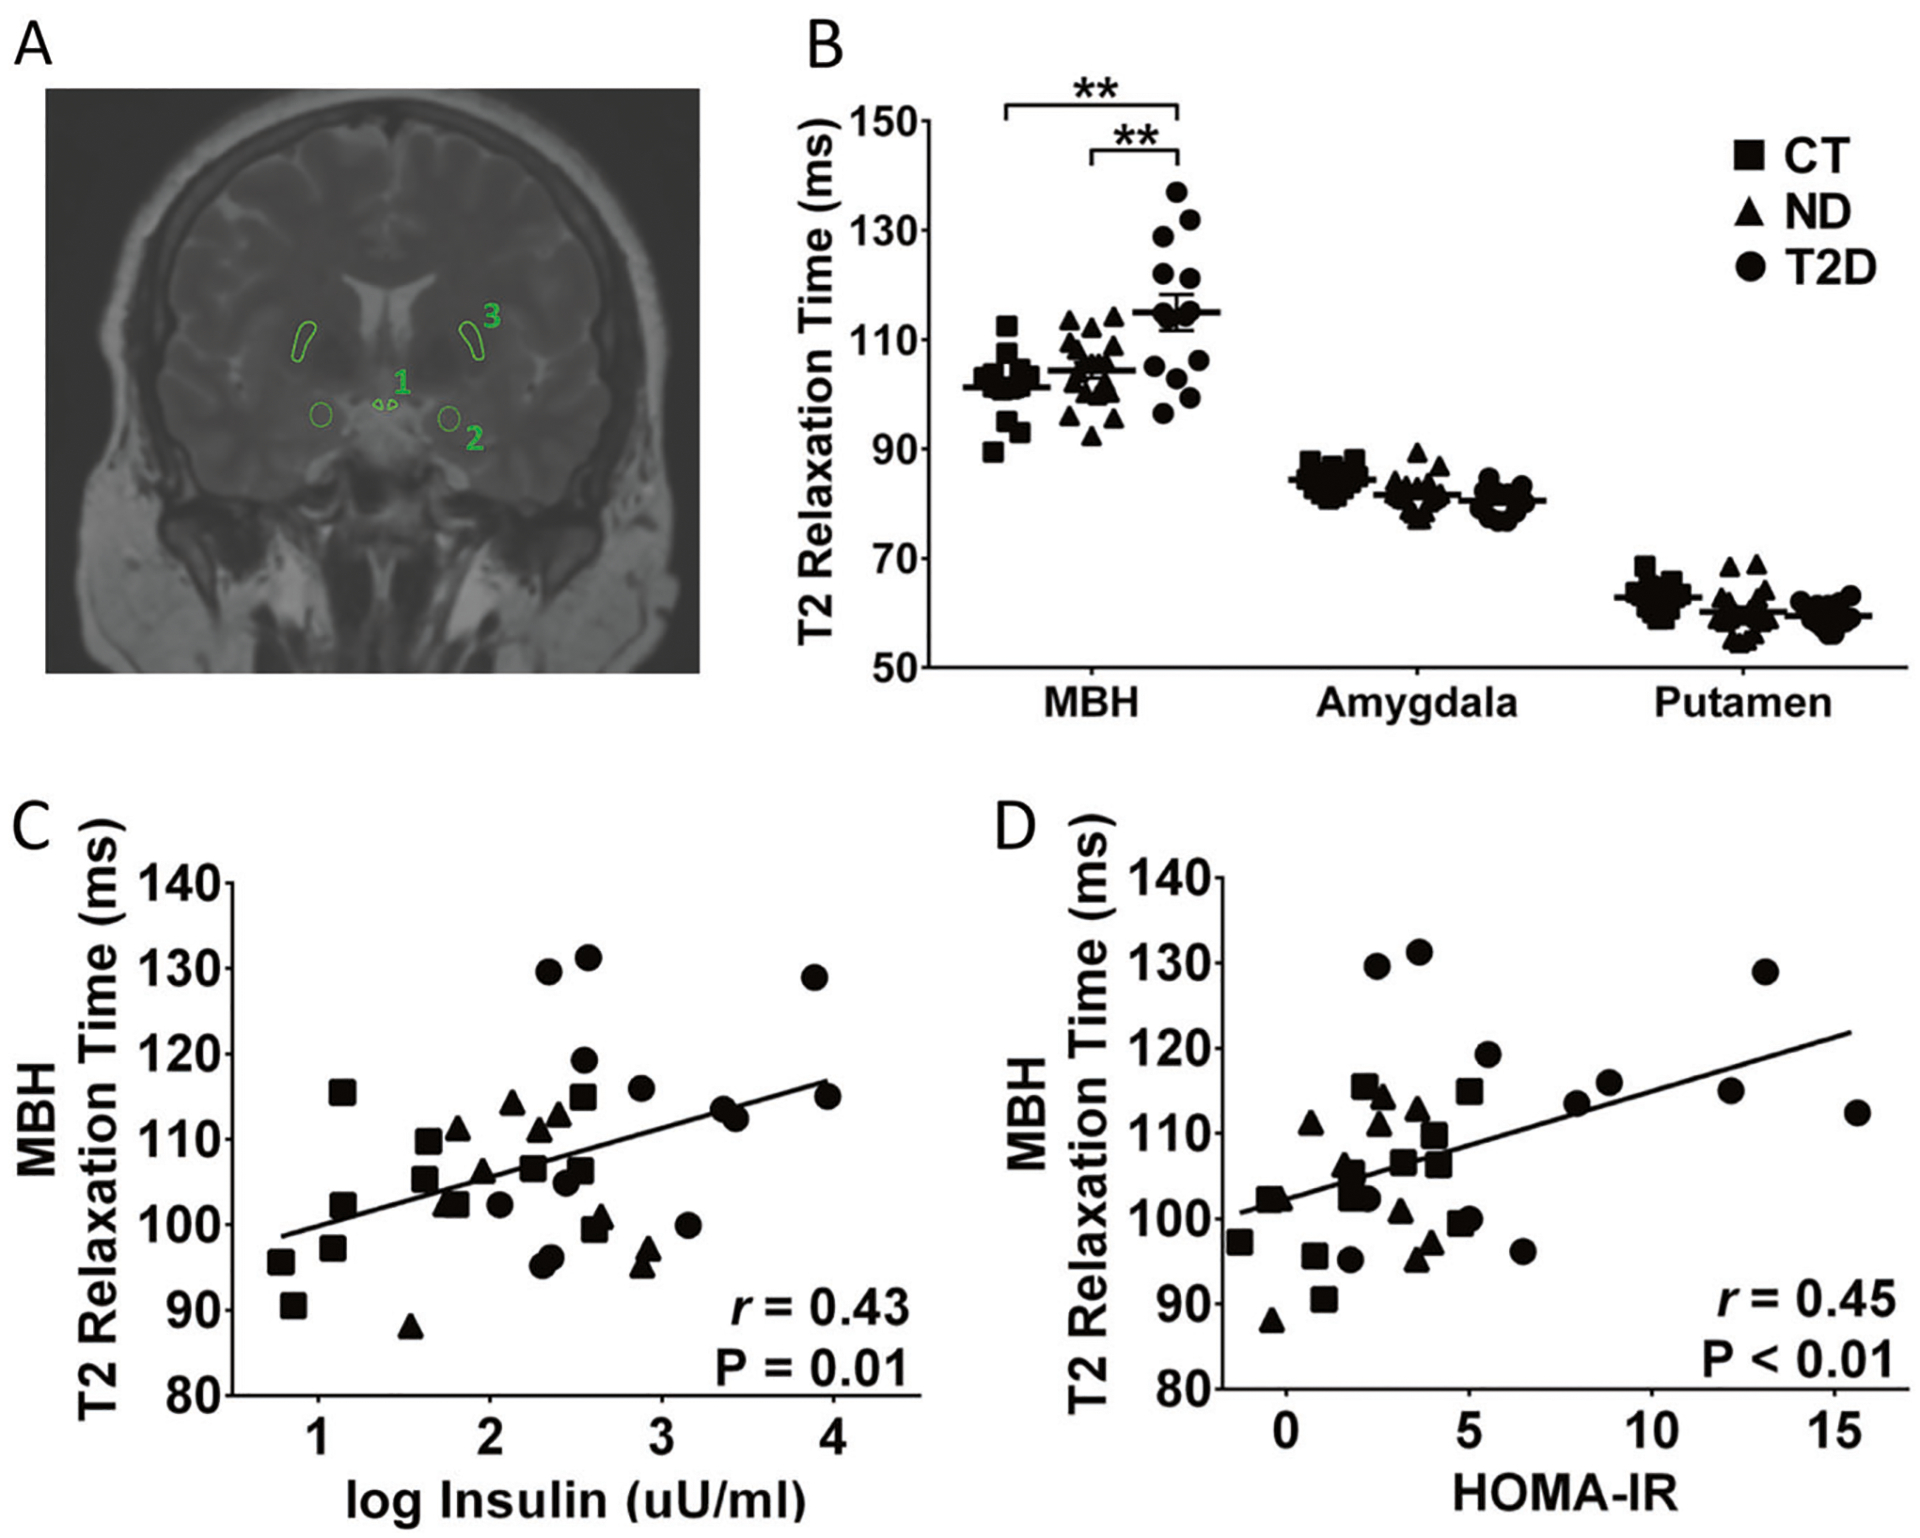
Fig. 1.

T2 relaxation time and correlation analysis. Schematic representation of the regions of interest; 1, mediobasal hypothalamus (MBH); 2, amygdala; 3, putamen (a). T2 relaxation time in lean controls (CT), obese non-diabetic (ND) and patients with type 2 diabetes (T2D) obtained for MBH, amygdala and putamen (b). Correlations between T2 relaxation time in MBH and blood insulin (c) and HOMA-IR (d). HOMA-IR, homeostatic model assessment for insulin resistance. **P < 0.01
