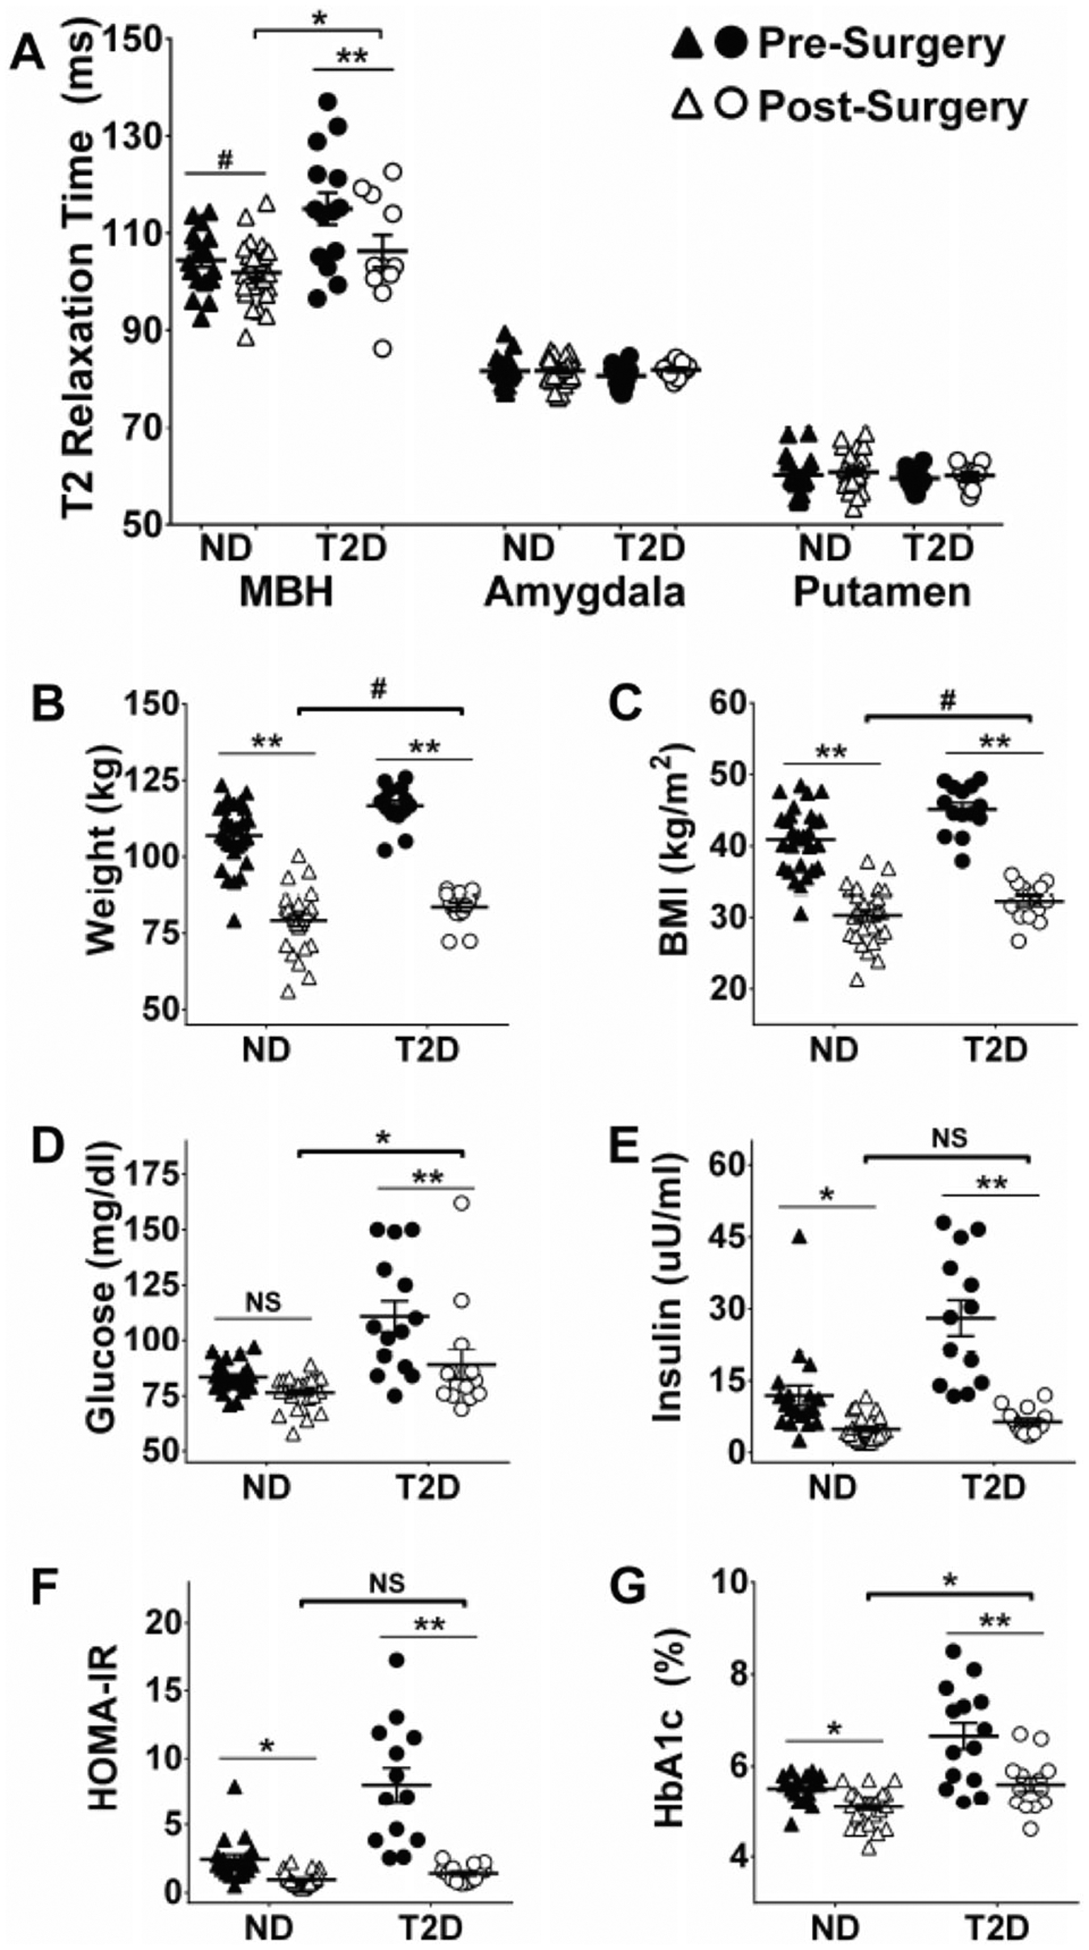
Fig. 2.

Effect of body mass reduction following Roux-in-Y gastric bypass on T2 relaxation time, body mass and markers of insulin sensitivity. T2 relaxation time before and after surgery in obese non-diabetic (ND) and patients with type 2 diabetes (T2D) obtained for mediobasal hypothalamus (MBH), amygdala and putamen (a). Body mass (b), body mass index (BMI) (c), blood glucose (d), blood insulin (e), homeostatic model assessment for insulin resistance (HOMA-IR) (f) and blood hemoglobin A1c (g) before and after surgery in obese nondiabetic (ND) and patients with type 2 diabetes (T2D). *P < 0.05 pre-surgery versus post-surgery within group (line) or ND versus T2D post-surgery (bracket); **P < 0.0001 pre-surgery versus post-surgery within group (line); #P < 0.01 pre-surgery versus post-surgery within group (line) or ND versus T2D post-surgery (bracket)
