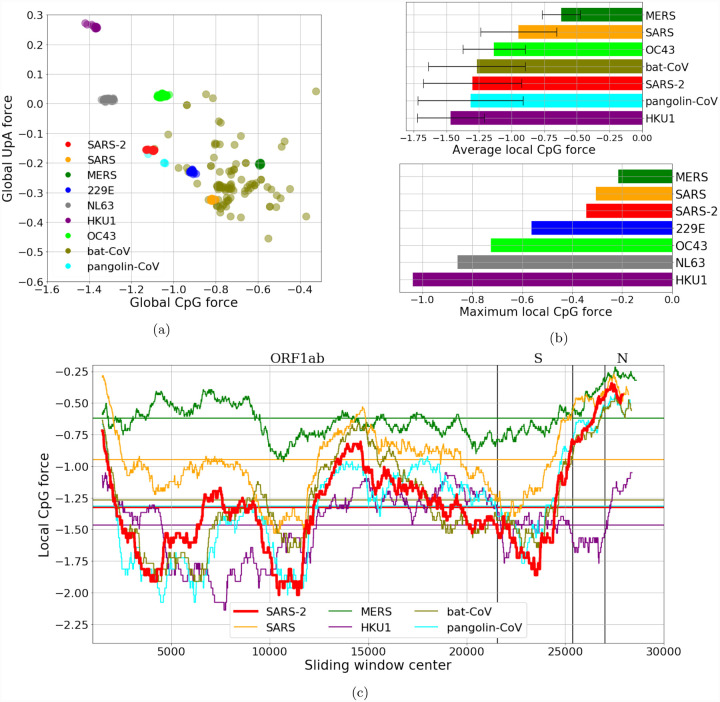
Figure 2: CpG and UpA forces and their local fluctuations in the coronaviriadae family.
(a):CpG Forces computed on the whole genome. Species are well clustered, due to the large conservation of the sampled sequences, except for the strains originating in bats which is a grouping of several diverse strains. The anticorrelation of the CpG and the UpA force is due to their complementarity. (b, c, d): Local analysis in sliding windows of 3 kb along the genome. Local forces along the genome (b, c): while the average CpG force of SARS-CoV-2 is relatively low, the variance along the genome is high with greater CpG forces in certain regions (such as the coding region for protein N) and lower CpG forces in other (e. g. coding region for protein S). (b)-lower panel: maximum value of the local CpG force showing that values for SARS-CoV-2 moves closer to the most dangerous viruses. The bat sequence analyzed in panels (b) and (c) is RaTG13, while the pangolin sequence has been sequenced at Guangdong, in 2019. Data from VIPR [24] and GISAID [25], see Methods Sec. 4.5 and SI.1.

