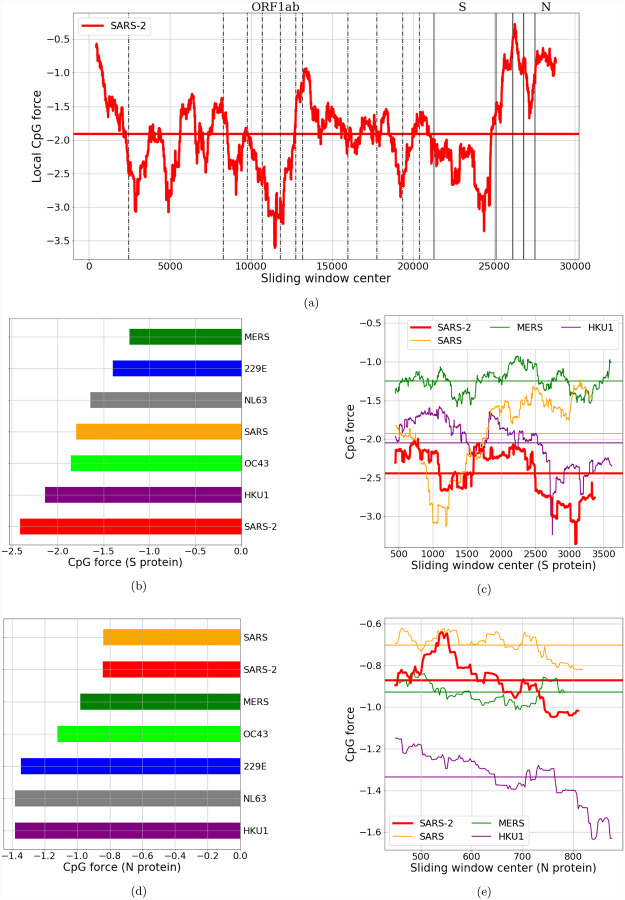
Figure 3: CpG local Forces on SARS-CoV-2 coding regions constrained by codon and amino acid usage.
(a): Local Forces, on sliding windows over 900 nucleotides, on all the coding regions of SARS-CoV-2 (pre-processed to ensure the correct reading frame, see Methods Sec. 4.5). The horizontal line denotes the average force. Many large fluctuations coincide with boundaries of protein domains, suggesting that recombination could have had a role in creating theses CpG force fluctuations. In panels (b) and (d): bar plots for average local forces for structural proteins in the Coronaviridae family. The two largest structural proteins, N and S, have very different forces in SARS-CoV-2. Each bar is obtained by averaging the CpG force over several sequences (from VIPR [24] and GISAID [25], see SI.1), and the standard deviation of the average (not shown) is lower than 0.025. (c) and (e): local forces for N and S compared with the same proteins of other beta-coronaviruses. Horizontal lines denote the average forces.

