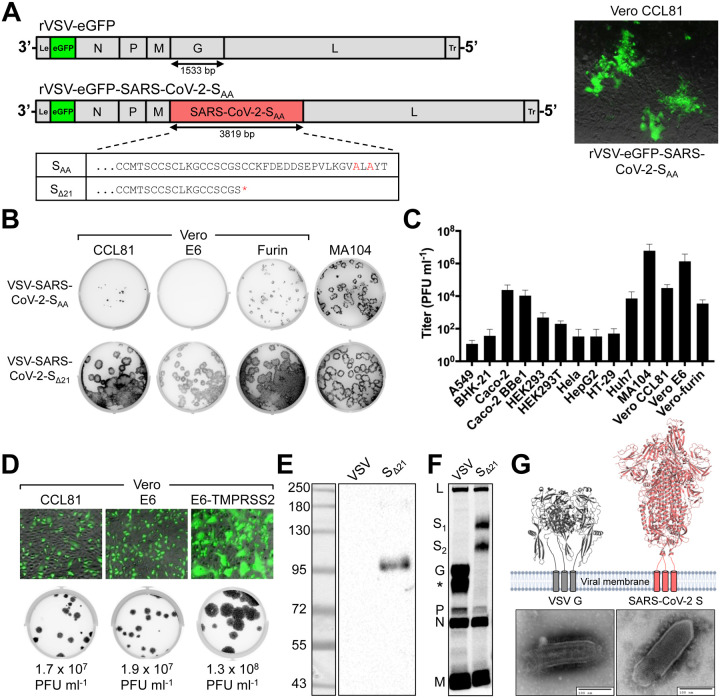
Figure 1. Generation and characterization of an infectious VSV-SARS-CoV-2 chimera.
(A) A schematic diagram depicting the genomic organization of the VSV recombinants, shown 3’ to 5’ are the leader region (Le), eGFP, nucleocapsid (N), phosphoprotein (P), matrix (M), glycoprotein (G) or SARS-CoV-2 S, large polymerase (L), and trailer region (Tr). (Right panel) Infection of Vero CCL81 cells with supernatant from cells transfected with the eGFP reporter VSV SARS-CoV-2-SAA. Images were acquired 44 hours post-infection (hpi) using a fluorescence microscope, and GFP and transmitted light images were merged using ImageJ. (Bottom panel) Alignment of the cytoplasmic tail of the VSV-SARS-CoV-2-SAA and the sequence resulting from forward genetic selection of a mutant, which truncated the cytoplasmic tail by 21 amino acids. Mutations deviating from the wild-type spike are indicated in red, and an asterisk signifies a mutation to a stop codon. (B) Plaque assays were performed to compare the spread of VSV-SARS-CoV-2-SAA rescue supernatant and VSV-SARS-CoV-2-SΔ21 on Vero CCL81, Vero E6, Vero-furin, and MA104 cells. Plates were scanned on a biomolecular imager and expression of eGFP is shown 92 hpi (representative images are shown; n>3 except for SAA on Vero E6, Vero-furin, and MA104 cells). (C) The indicated cell types were infected with VSV-SARS-CoV-2-SΔ21 at an MOI of 0.5. Cells and supernatants were harvested at 24 hpi and titrated on MA104 cells (data are pooled from three or more independent experiments). (D) (Top panel) The indicated cells were infected with VSV-SARS-CoV-2-SΔ21 at an MOI of 2. Images were acquired 7.5 hpi using a fluorescence microscope and GFP, and transmitted light images were processed and merged using ImageJ (data are representative of two independent experiments). (Bottom panel) Plaque assays were performed on the indicated cell types using VSV-SARS-CoV-2-SΔ21. Images showing GFP expression were acquired 48 hpi using a biomolecular imager (data are representative of at least 3 independent experiments). (E) Western blotting was performed on concentrated VSV-SARS-CoV-2-SΔ21 and wild-type VSV particles on an 8% non-reducing SDS-PAGE gel. S1 was detected using a cross-reactive anti-SARS-CoV mAb (CR3022) (data are representative of two independent experiments). (F) BSRT7/5 cells were inoculated at an MOI of 10 with VSV-eGFP, G-complemented VSV-SARS-CoV-2-SΔ21, or mock infected (not shown), and metabolically labeled with [35S] methionine and cysteine for 20 h starting at 5 hpi in the presence of actinomycin D. Viral supernatants were analyzed by SDS-PAGE. A representative phosphor-image is shown from two independent experiments. An asterisk indicates a band that also was detected in the mock lane (not shown). (G) Purified VSV-WT and VSV-SARS-CoV-2-SΔ21 particles were subjected to negative stain electron microscopy. Prefusion structures of each respective glycoprotein are modeled above each EM image (PDB: 5I2S and 6VSB).

