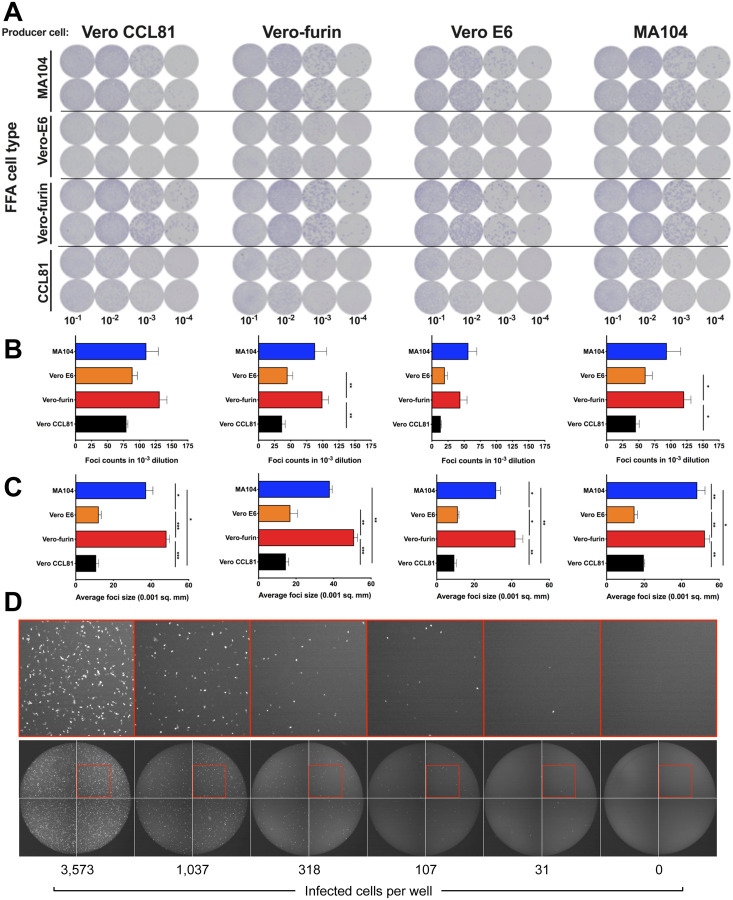
Figure 2. Development of a SARS-CoV-2 focus-forming assay and a VSV-SARS-CoV-2-SΔ21 eGFP-reduction assay.
(A) Representative focus forming assay images of viral stocks generated from each producer cell type (top) were developed on the indicated cell substrates (indicated on the left side). Data are representative of two independent experiments. Foci obtained in (A) were counted (B) and the size was determined (C) using an ImmunoSpot plate reader (* P < 0.05, ** P < 0.01, *** P < 0.001 1 by One-way ANOVA with Tukey’s multiple comparisons test). (D) Representative serial dilution series of VSV-SARS-CoV-2-SΔ21 on Vero E6 cells. The total number of infected cells per well was quantified using an automated microscope. Insets of enhanced magnification are shown in red. Data are representative of two independent experiments.

