FIGURE 3.
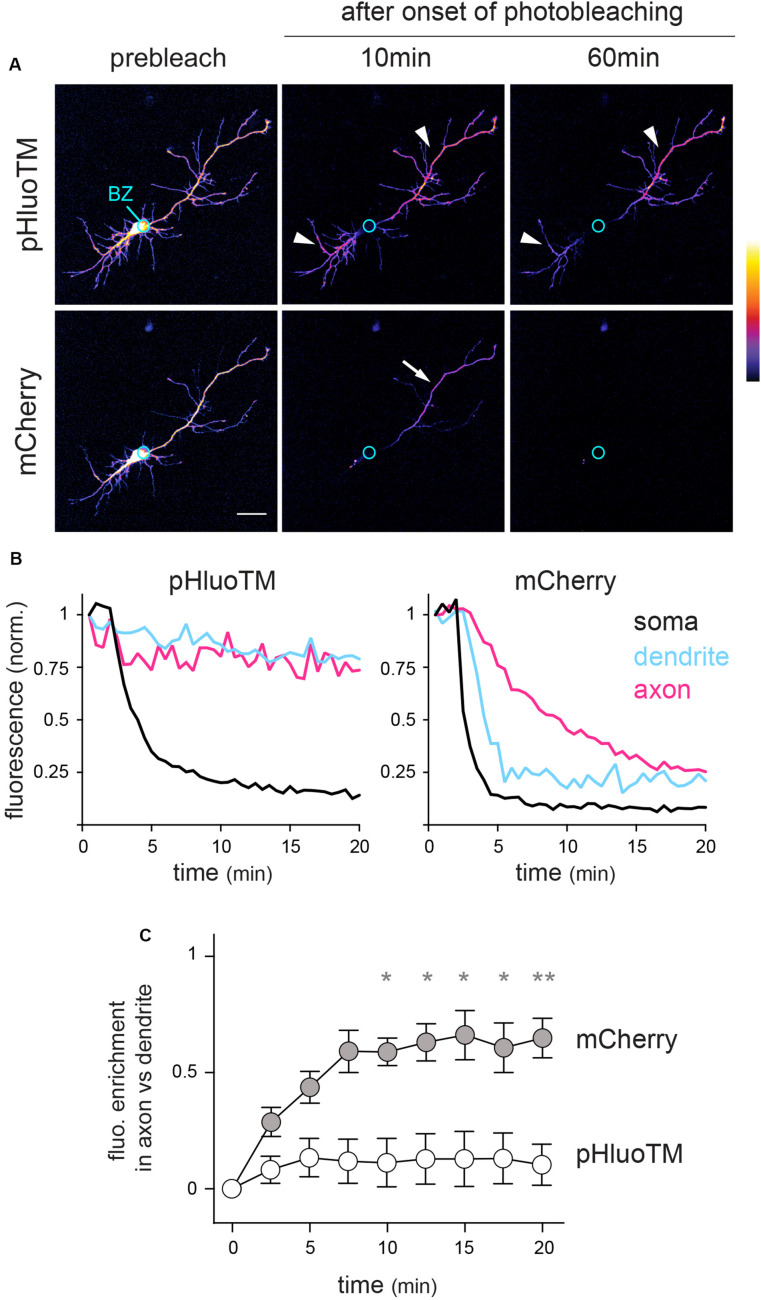
FLIP reveals contrasted constraints on the dynamics of cytoplasmic and surface transmembrane proteins. (A) mCherry and pHluoTM fluorescence (maximum intensity projections – color coded) in a DIV5 neuron before and 10 and 60 min after onset of photobleaching in the soma (bleached zone, BZ, marked by a circle). Scale bar 50 μm. (B) Example plots of mCherry and pHluoTM fluorescence decay in the bleached zone and 75 μm away from the soma in a presumed dendrite and in the presumed axon, same cell as in A). (C) Population analysis: fluorescent enrichment in axons vs. dendrites ([Faxon - Fdendrite]/[Faxon + Fdendrite]; mean ± SEM, N = 8 cells) at the indicated time after onset of photobleaching in intermediate segments of dendrites and axons (60 or 100 μm away from the soma). *p < 0.05; **p < 0.01; Kruskal–Wallis’ multicomparison test). In (A–C), note that pHluoTM fluorescence is rapidly and completely depleted from the soma and proximal neurites but remains largely unaffected in distal neurites (arrowheads). In contrast, mCherry fluorescence is rapidly depleted from the entire neuron, albeit with much slower kinetics in a single neurite (arrow): the presumed axon.

