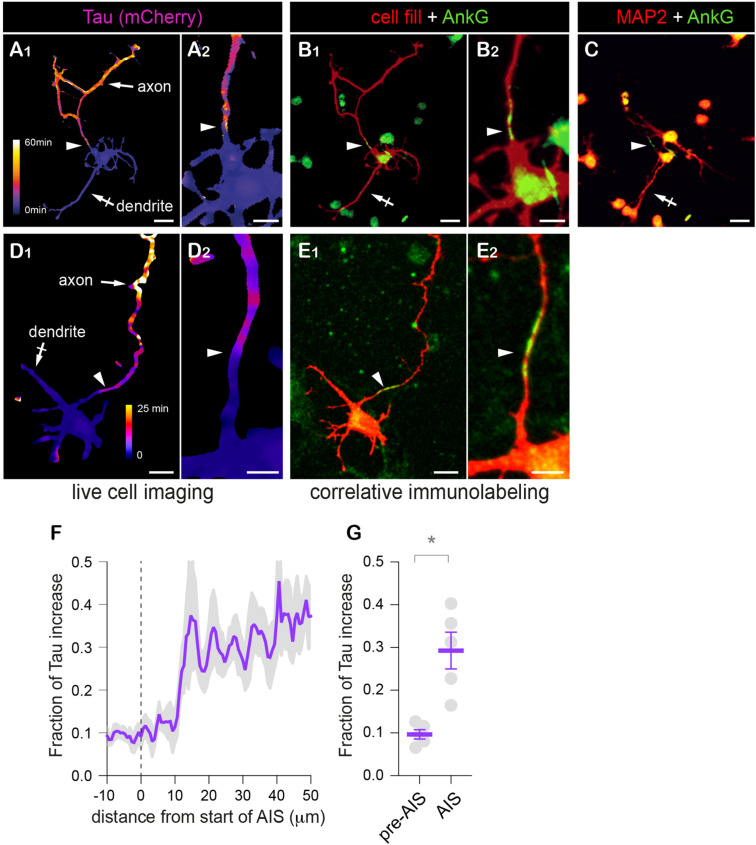
FIGURE 5.
Retrospective immuno-labeling confirms the identity of the presumed AIS. (A–E) Variation of mCherry (A1,A2) or tdTom (D1,D2) decay speed (tau heat maps) and distributions of mCherry (prebleach fluorescence, red in B1,B2) or co-expressed cell fill (GFP, red in E1,E2), Ankyrin G (AnkG, green in B1,B2,E1,E2) and MAP2 (red in C) in DIV3 (A–C) or DIV 5 (E,D) neurons at low (A1,B1,D1,E1,C) or higher magnification (A2,B2,D2,E2). Scale bar 25 or 12.5 μm. (F) Fractional increase of Tau along the axon in relation to the start of the AIS (as in B,E). (G) Averaged fractional increase before (−10 to 0 μm) and in the AIS (−10 to 20 μm). Shown are means ± SEM from N = 7 neurons. *p < 0.05; Wilcoxon’s matched-paired test. In (A–E), note that the presumed axon identified by the slower decay of mCherry or tdTom (arrow in A1,D1) does not express MAP2 (in contrast to a presumed dendrite, crossed arrow in A1,C) and displays an ankyrin G-positive AIS (arrowheads in B1,B2,E1,E2), and can thus be identified as the axon. Tau increased is particularly marked a few tens of microns from the soma and is coordinated to the location of the AIS identified by AnkG (arrowheads). In (F), note the ∼10 μm offset between the start of the AIS and Tau increase. In (G), note the higher values of Tau after the first 10 μm of the AIS.

