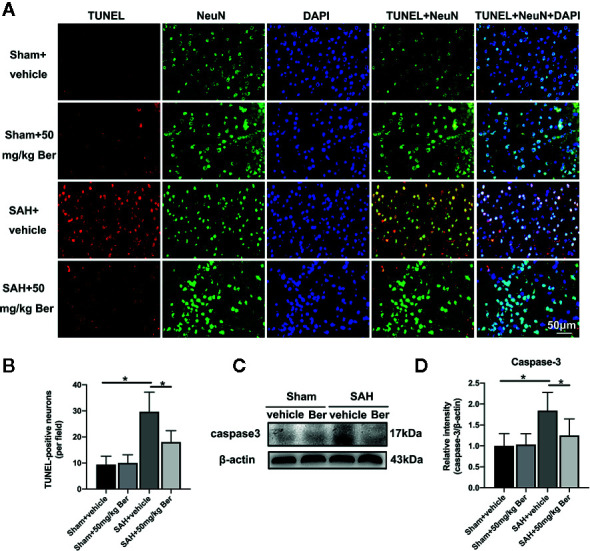
Figure 3.

Effects of berberine on neural apoptosis after SAH. (A, B) Representative photomicrographs (A) and quantification (B) of TUNEL staining. n = 6 per group. (C, D) Western blot assay (C) and quantification for the expression of caspase-3 (D) in the indicated groups. n = 6 per group. Bars represent the mean ± SD. * P < 0.05.
