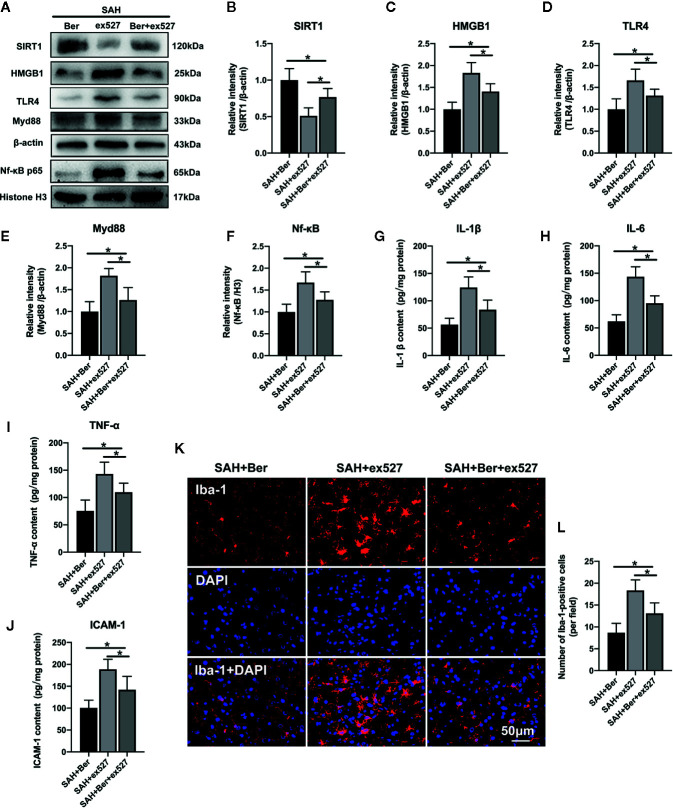
Figure 5.
Effects of ex527 treatment on SIRT1/HMGB1/TLR4/Myd88/Nf-κB signaling pathway after SAH. (A–F) Western blot assay (A) and quantification for the expression of SIRT1 (B), HMGB1 (C), TLR4 (D), Myd88 (E), and Nf-κB p65 (F) in the indicated groups. n = 6 per group. (G–J) Quantification of IL-1β (G), IL-6 (H), TNF-α (I) and ICAM-1 (J) protein expressions in all groups. n = 6 per group. (K) Representative photomicrographs of immunofluorescence staining for Iba-1. (L) Quantitative analysis of the Iba-1 immunofluorescence staining. n = 6 per group. Bars represent the mean ± SD. * P < 0.05.

